Stocks have (shockingly) broken into the green for 2020 … but few folks are celebrating. That’s understandable: coronavirus cases are surging and another wave of lockdowns is a real possibility.
But there is good news here.
First off, I’ve found a “heads-you-win, tails-you-win” fund that’s perfect for these times. It pays a 7.5% dividend and boasts a portfolio of stocks we know well: Microsoft (NASDAQ:MSFT), Apple (NASDAQ:AAPL), Amazon.com (NASDAQ:AMZN) and Mastercard (NYSE:MA) among them.
Before we get to this fund, we need to take a close look at this levitating market so we can see exactly what it means for our portfolios as we move into the unpredictable back half of 2020.
Earnings Suggest Another Pullback, But …
So far, companies that have reported second-quarter earnings have seen a roughly 40% decline, the worst drop since the end of 2008. And stock prices are supposed to be connected to earnings, so should we expect a 40% drop in stocks, too?
To answer that, let’s look back to another crisis year: 2008. The biggest, and most obvious, difference between the crises is that today we’re in a forced slowdown of economies to stave off the spread of a virus, while in 2008, a bubble burst after years of assets being overvalued.
In other words, this is a difference between stocks and flows. In 2008, the stock of financial capital (subprime mortgages, mortgage-backed securities, bank balance sheets, real-estate-developer stocks) was thought to be worth more than it really was, so the bubble sharply reduced the value of these assets.
In 2020, the flow of cash from economic activity has been disrupted. The potential to create that economic activity is still there and has retained most of its value. We just can’t use it to its fullest capacity.
Of course, stocks influence flow, and flow influences stocks. When the bubble burst in 2008, a lot of people lost their jobs, which ended up hitting the flow of cash from economic activity. Similarly, the loss of cash flow in 2020 means people are buying less stuff, which ultimately will affect the market value of the companies that produce that stuff.
But so far, the S&P 500 is not lowering the value of companies; it’s assuming that consumption will revert to pre-crisis levels sooner rather than later. That’s the assumption we need to test.
… There Are Signs of Life in This Economy
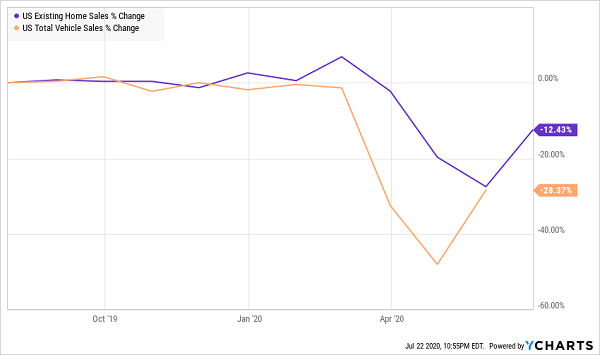
To determine whether we’re heading back toward a more normal economy, we need to look at consumer confidence. The best way to do that is to focus on how people are really spending their money.

I’ve zeroed in on home sales and vehicle sales because they’re big-ticket items; Americans won’t buy either if they feel uncomfortable about the future.
That’s not what’s happening. Keep in mind that this data is only up until June, but we still see that Americans were starting to get back to pre-crisis levels. We’re not there yet, but we’re getting closer—and with July having opened up more than June, there’s reason to believe both of these numbers will be better when they come out in August.
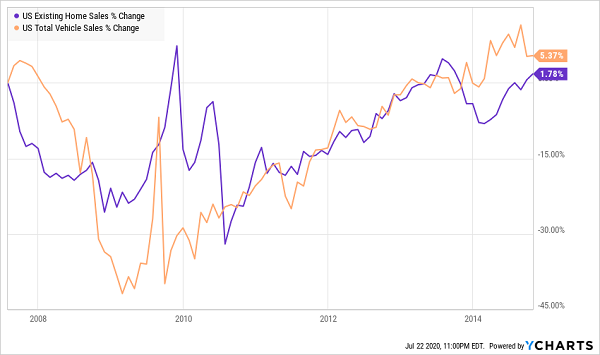
Now let’s compare this to 2008 and its aftermath.

As you can see, it took years to see a sustained recovery in home and vehicle sales post-2008, because so much economic value had been obliterated and was hard to rebuild. But now, there’s much less to rebuild, making it easier to get back to normal.
A 7.5% Dividend For Cautious Investors
In this kind of market, there’s reason to be optimistic, but we also see that the market has priced in a lot of that optimism. So there’s reason for caution, too.
An environment like this calls for a special kind of CEF: a covered-call fund.
Covered calls are a kind of option strategy where you own a basket of stocks and sell call options against those stocks. Call options are a contract where you sell the right to buy your stocks to an investor at a fixed share price in exchange for a cash payment. This gives you protection from a downturn, since you’re getting that fixed price for cash, and those options become worthless if the stock does go down.
This method of tapping a stock portfolio for cash is popular among millionaires and billionaires, but everyone can do it with closed-end funds (CEFs) like the Nuveen S&P 500 Dynamic Overwrite Fund (NYSE:SPXX).
This fund tracks the S&P 500 but also sells options on its portfolio and hands that cash to investors. That’s how SPXX yields 7.5%, plenty of income to get you through the next few months while also investing in well-known S&P 500 stocks that aren’t known for high payouts.
Disclosure: Brett Owens and Michael Foster are contrarian income investors who look for undervalued stocks/funds across the US markets.
