Stocks had a big move higher this past week on vaccine hopes, and pretty much flatlined after that, with the S&P 500 gaining around 3%. However, the market left itself in a vulnerable spot to start the final week of May. Trends overall are not all that bullish as the index continues to post signs of fading momentum.
S&P 500
It does leave open a powerful possibility that the index makes its way lower the week of May 25 towards 2,860. That would allow the index a chance to fill the gap created on Monday, but still keep the index around and uptrend that formed off the March lows.
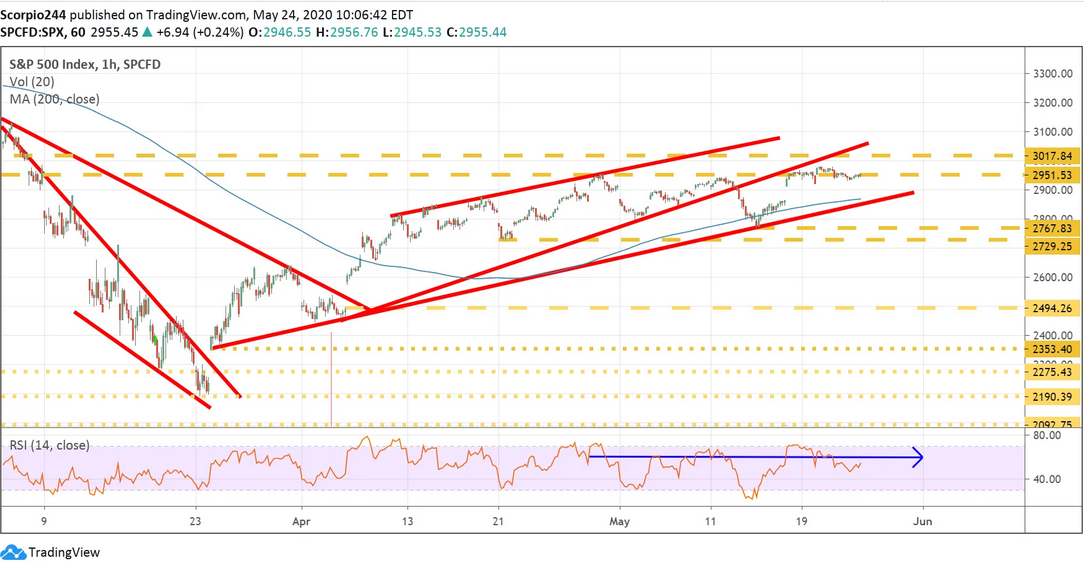
Again, the signs of fading momentum can be seen by the flattening of the relative strength index and the advance-decline line.
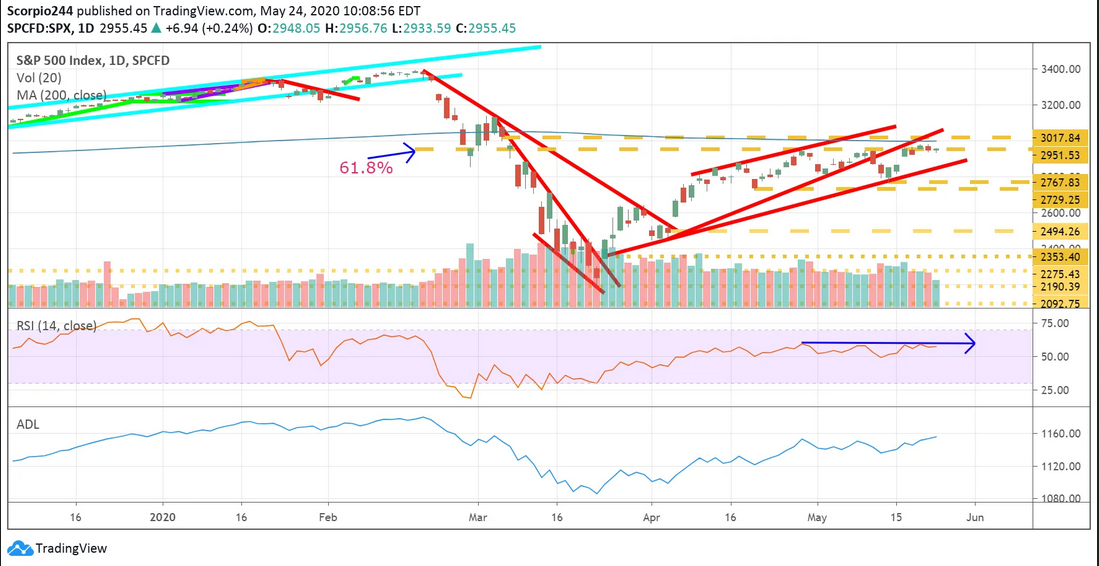
Should the index find, the bullish momentum to continue pushing higher, the next significant level of resistance for the S&P 500 doesn’t come until about 3,020.
NASDAQ (QQQ)
The Invesco (NYSE:IVZ) NASDAQ 100 ETF (NASDAQ:QQQ) is also showing some of the same signs of fatigue. The index did rise this week, but it came on declining levels of volume. Additionally, the ETF is now trading at the upper of the trading channel. That has typically resulted in a decline of about 5% to the lower end of the trading channel. Also, the RSI is flattening out as well, despite the rising ETF.
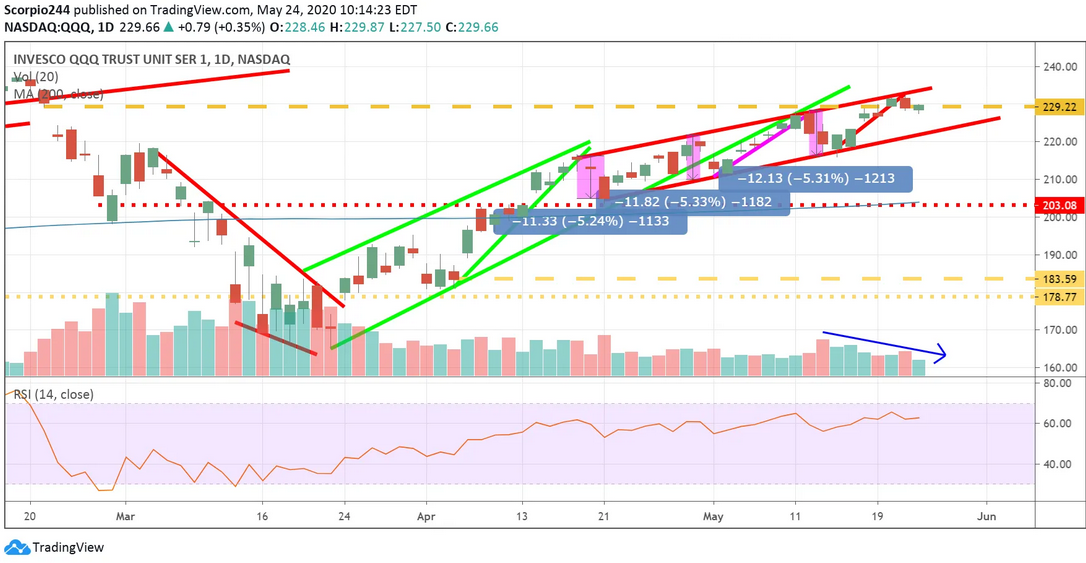
Some people think that these trends I point out, are supposed to happen immediately, but unfortunately, that is just not how it works. Could the ETF fall to the lower end of the trading channel this coming week, it could? But it could also take two weeks for all I know. Again, it is about the trend and the direction, not the length of time.
Microsoft
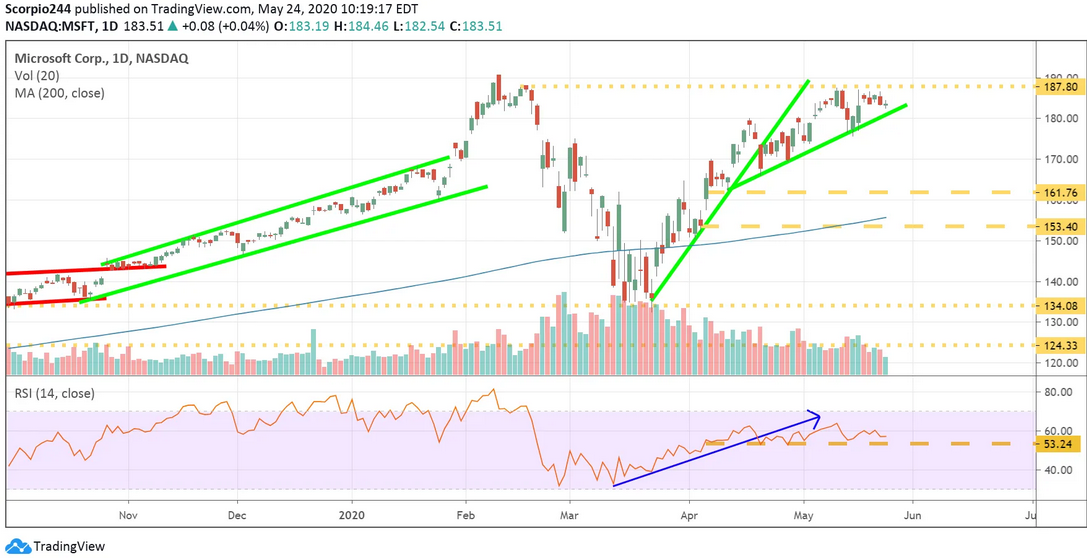
Microsoft (NASDAQ:MSFT) is one of those stocks that has not gone much of anywhere since the beginning of May. Again, like the Qs and the SPY, Microsoft has seen its RSI flatten dramatically, if not begin to turn lower. Volume levels have also dropped significantly, again signs of lost momentum. Microsoft has managed to hold the uptrend, and as long as that is the case, then shares can continue to challenge resistance around $188. If not, then there is an excellent chance the stock dips back to $162.
Netflix
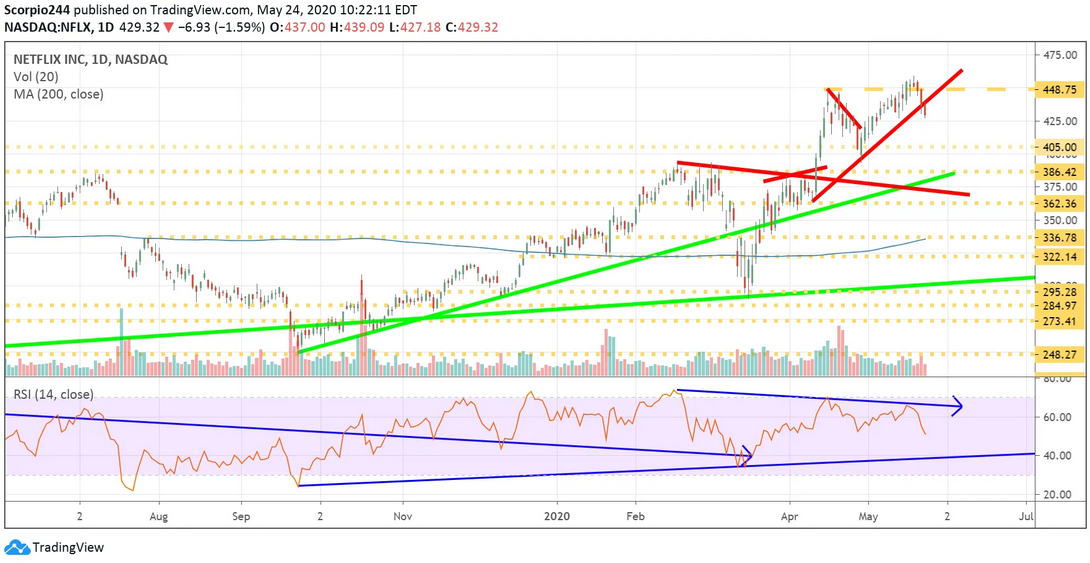
Has Netflix’s big run finally ended? Maybe, hard to tell for sure. But again, the RSI is now firmly trending lower, and the uptrend is broken. A drop to $405 would likely be the first stop.
AMD (AMD)
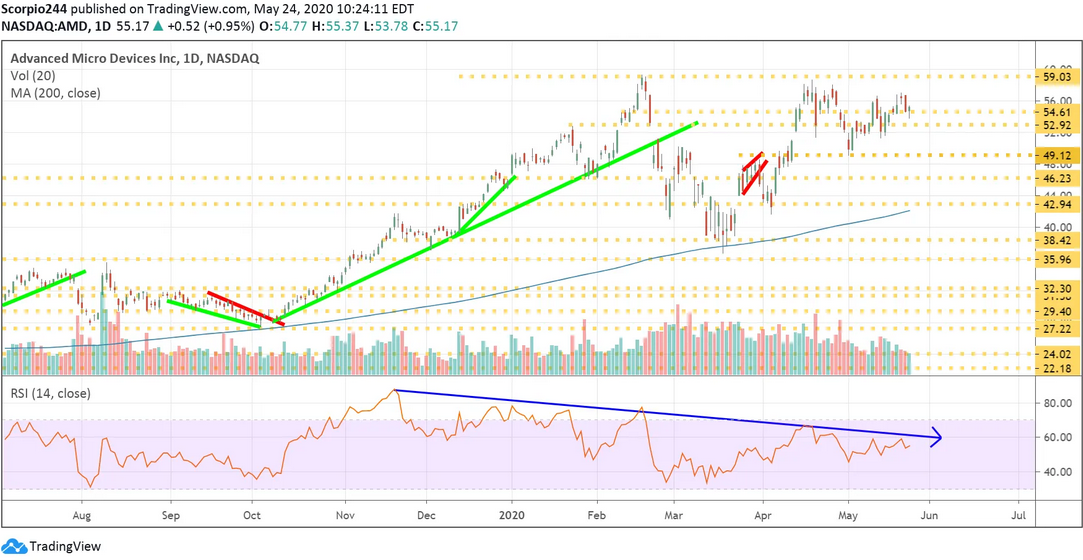
Advanced Micro Devices (NASDAQ:AMD) is another stock with bearish trends. The RSI is moving lower, volume levels are falling, and the stock has stopped rising to higher highs. A drop back to $49 looks reasonable.
Roku
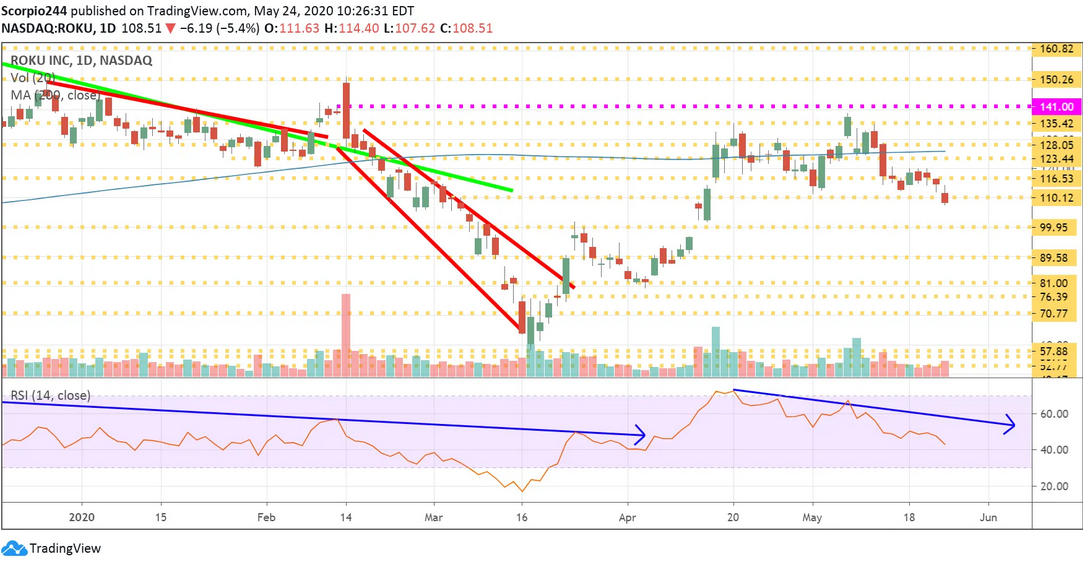
Roku (NASDAQ:ROKU) closed below $110 on Friday, and it appears to be picking up bearish momentum, with RSI that is trend lower, and volume levels that are rising as the stock falls. The next level of support comes around $99.
Gilead
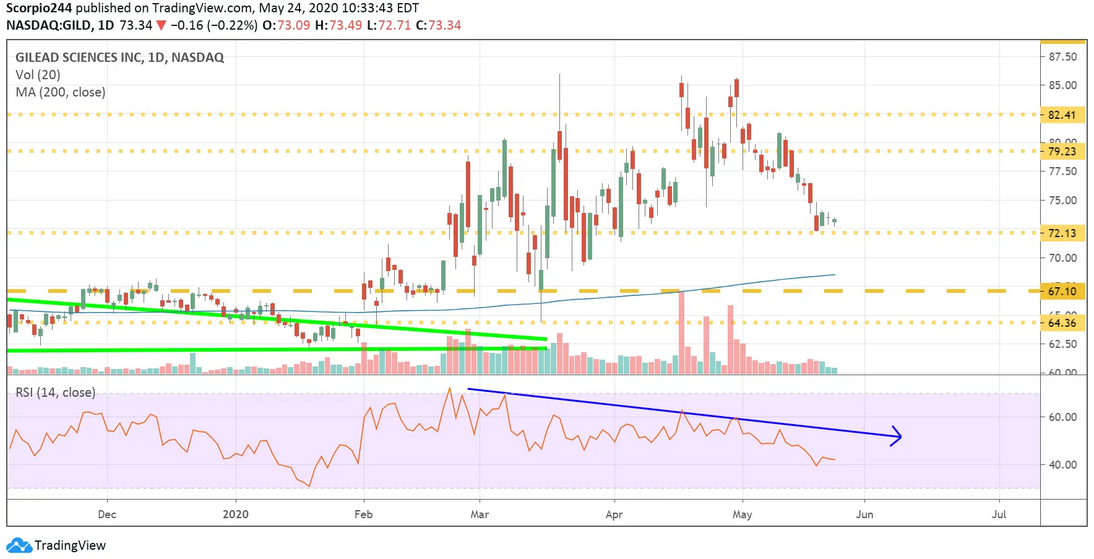
I noted earlier last week I was seeing a bunch of bearish options betting Gilead (NASDAQ:GILD) . A drop below $72 sets up a decline to $67.
Alibaba
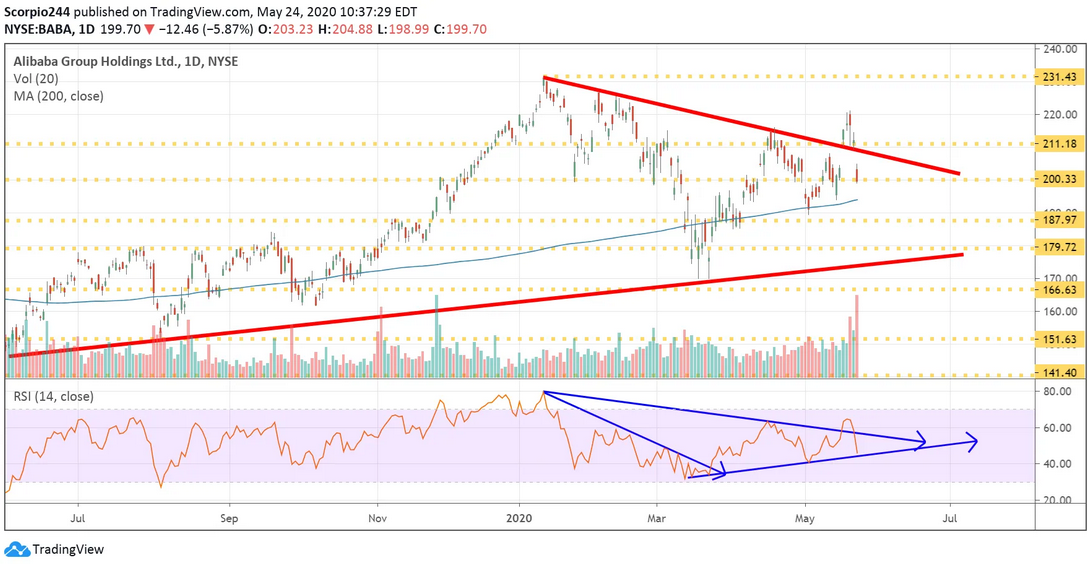
Alibaba (NYSE:BABA) got crushed this week on worries over China-US tensions. A break of $200 sets up a further drop to $188. The stock fell on massive volume last week, and the uptrend in the RSI is near breaking, not a good sign.
