Get 40% Off
💰 Buffett reveals a $6.7B stake in Chubb. Copy the full portfolio for FREE with InvestingPro’s Stock Ideas toolCopy Portfolios

8 Monster Stock Market Predictions For The Week Of May 11

Published 05/11/2020, 01:18 AM
Updated 09/20/2023, 06:34 AM
US500
-
LLY
-
SPY
-
AAPL
-
AMZN
-
AMGN
-
META
-
JD
-
UBER
-

Economic news will be less prominent this week, but we will see a big options expiration on Friday. The most significant open interest level on the board is at 3,000, and one has to think that level may act as a magnet for the market, pulling the S&P 500 higher this week towards that strike price.
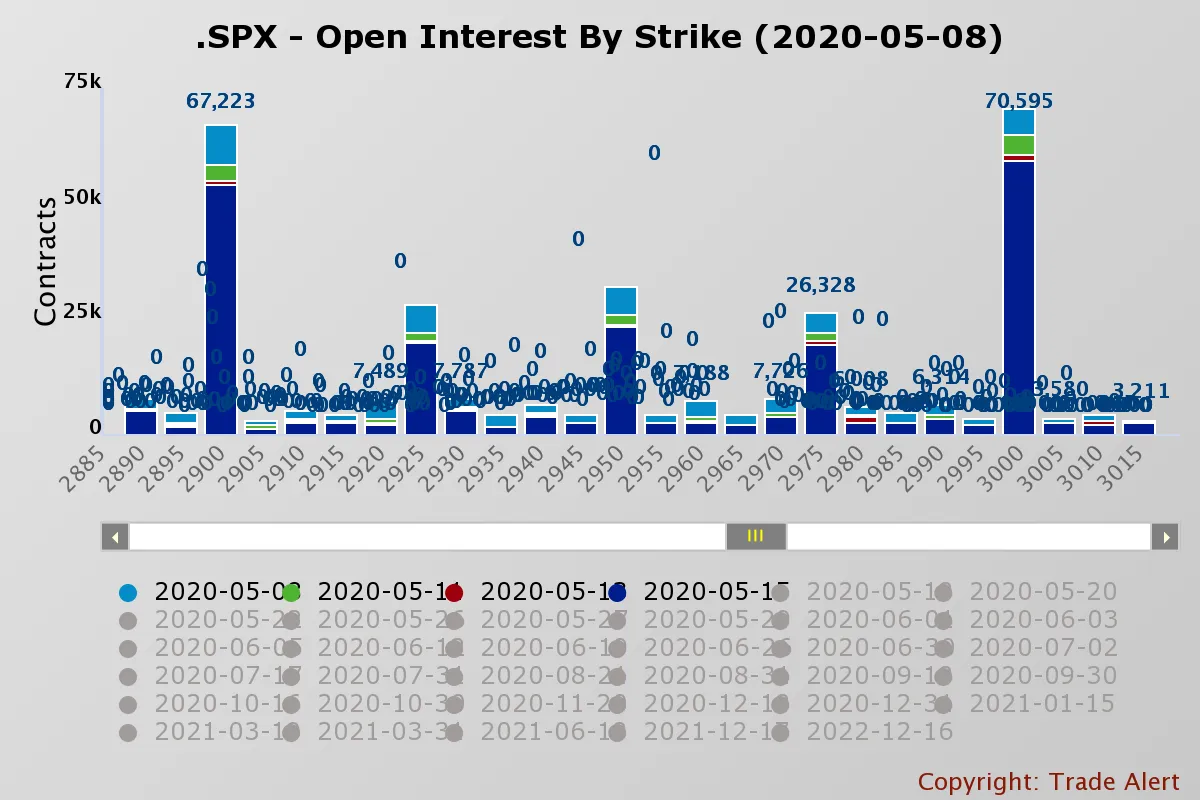
SPX Open Interest By Strike

S&P 500 (SPY)

There is a path for the index to reach 3,000 this week with a gap to fill at that level. But first, the index needs to get over resistance at 2,960, which does seem possible given that the relative strength index is still 58.
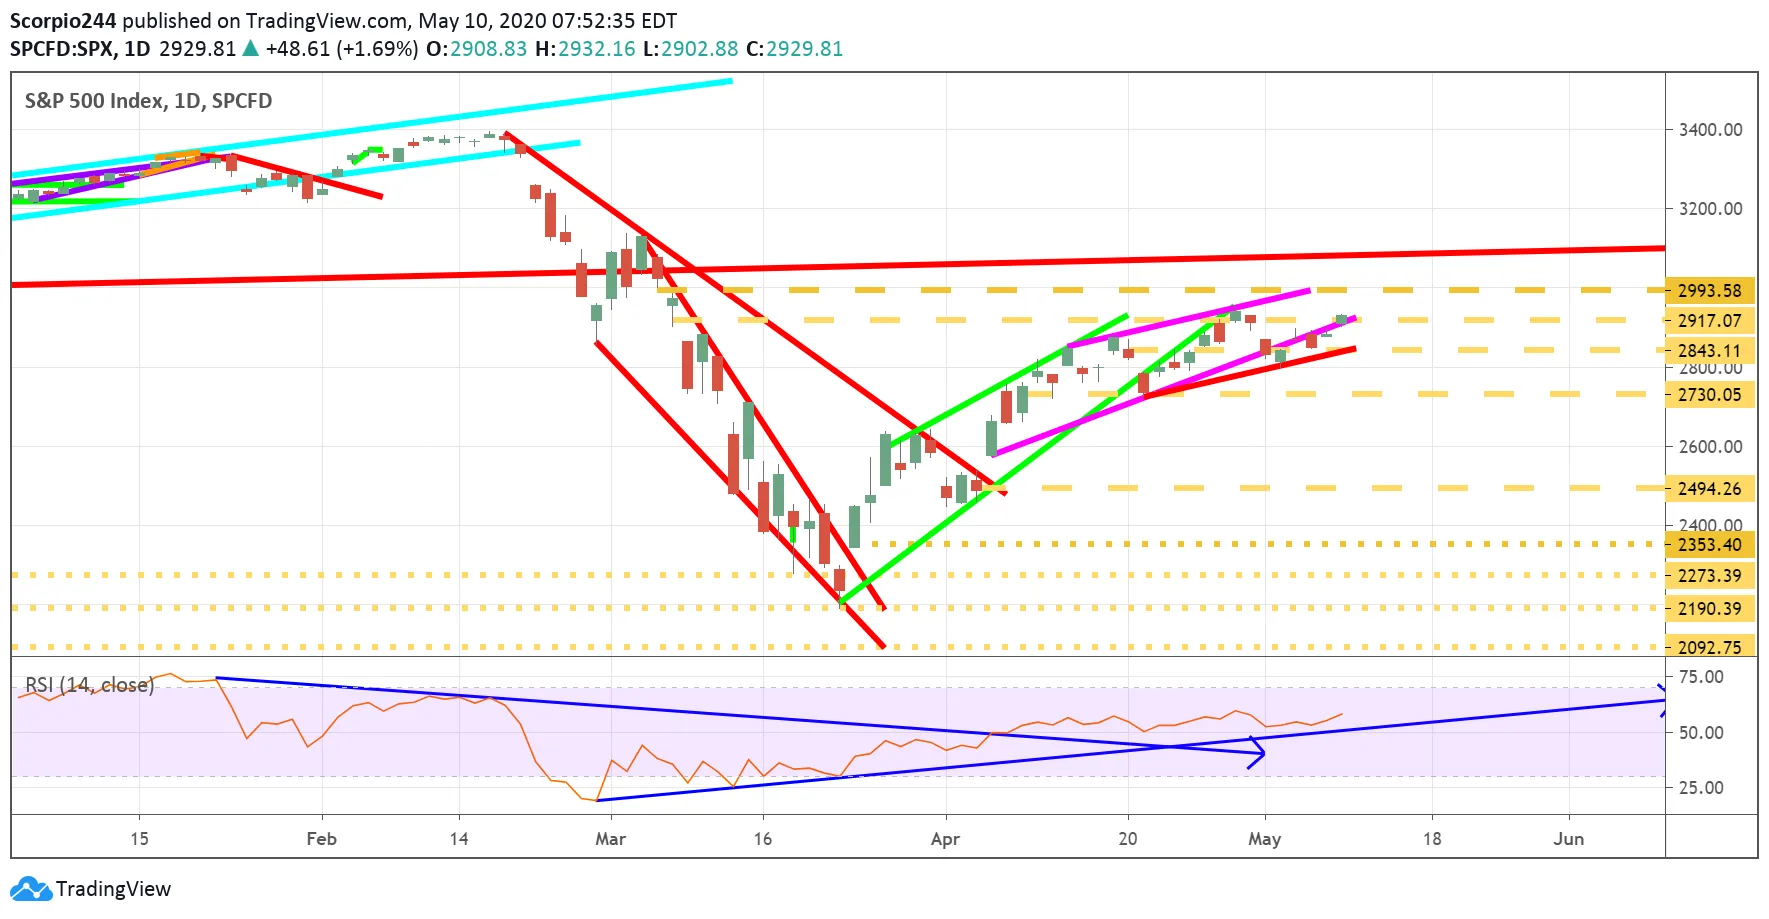
S&P 500 Index Daily Chart

Amazon (AMZN)

If the index is going to make that run higher, it is going to need Amazon (NASDAQ:AMZN) to be one of those stocks to help push it there. The stock has been holding an uptrend for the past two weeks, with a healthy level of resistance around 2,440. There is a bearish divergence forming with the RSI, which suggests the stock is likely to drift lower longer-term. However, the stock may just have enough juice left to keep it moving higher for one more week.
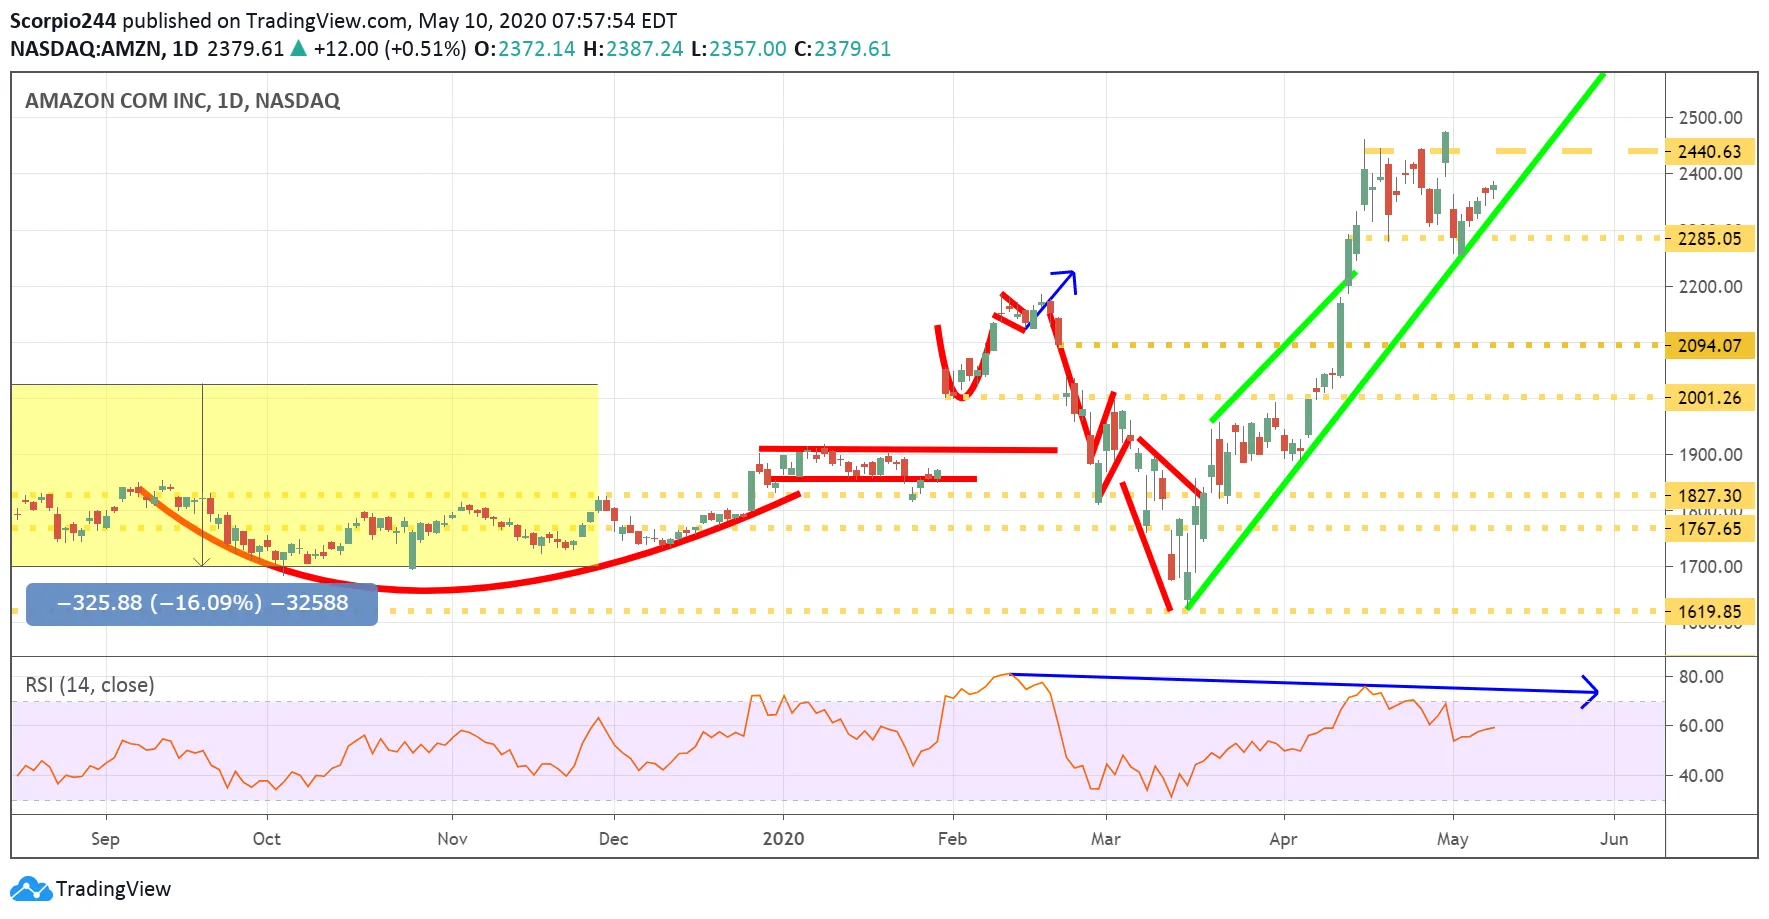
Amazon Inc Daily Chart

Apple (AAPL)

Apple (NASDAQ:AAPL) may still have a little upside left too, but it is running short on room. The big questions will be what happens to the stock after it fills the gap at $311. Meanwhile, the stocks RSI is approaching 70, and overbought levels.
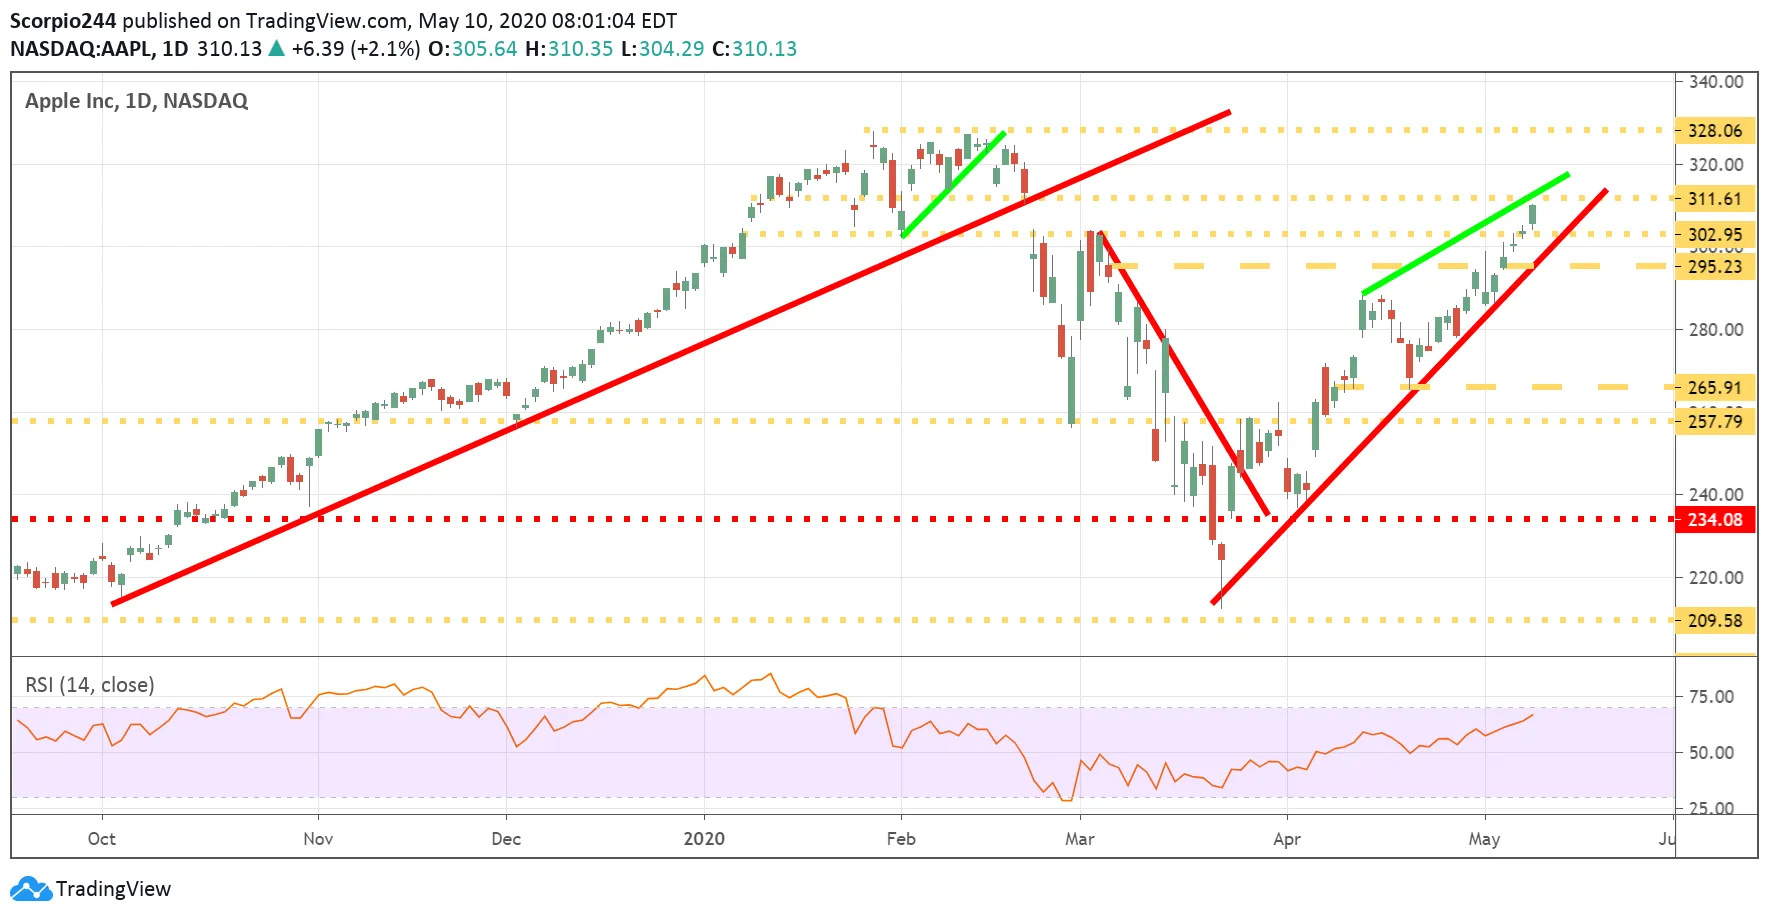
Apple Inc Daily Chart

Uber (UBER)

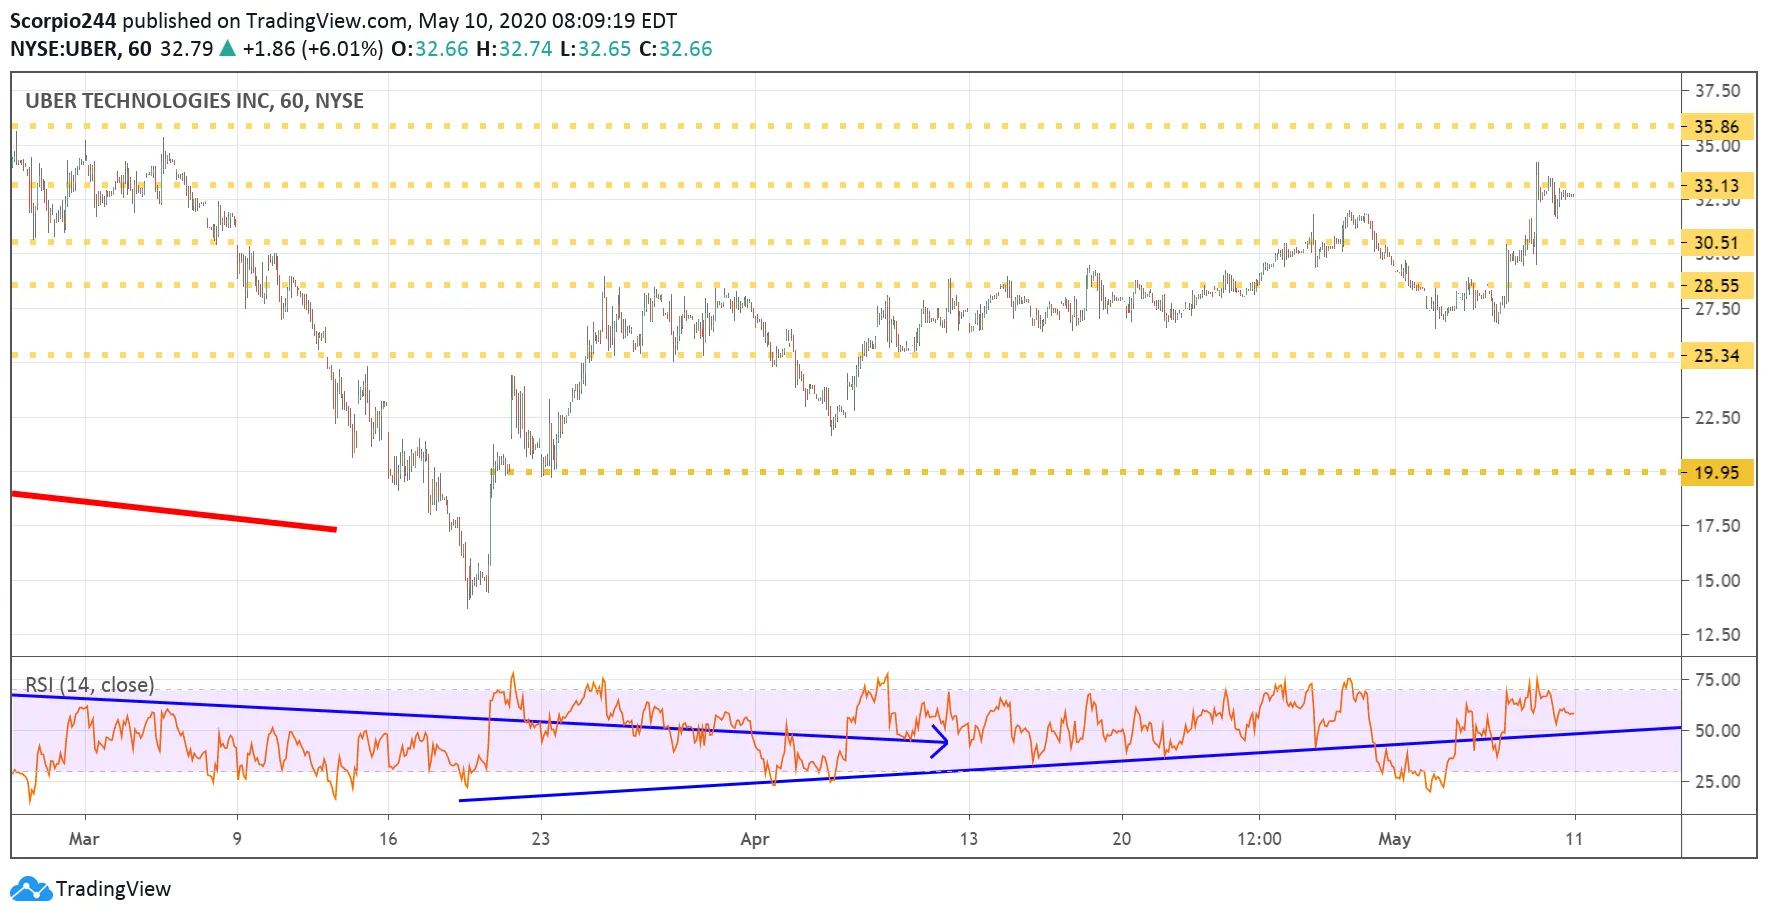
Uber (NYSE:UBER) is facing a severe level of resistance at $33, and after last week’s horrible results, I find it hard to believe that this one can continue to rise. I’m guessing it to comes back to $30.50.
3rd party Ad. Not an offer or recommendation by Investing.com. See disclosure here or remove ads .

Uber Tech Inc Chart

Facebook (FB)

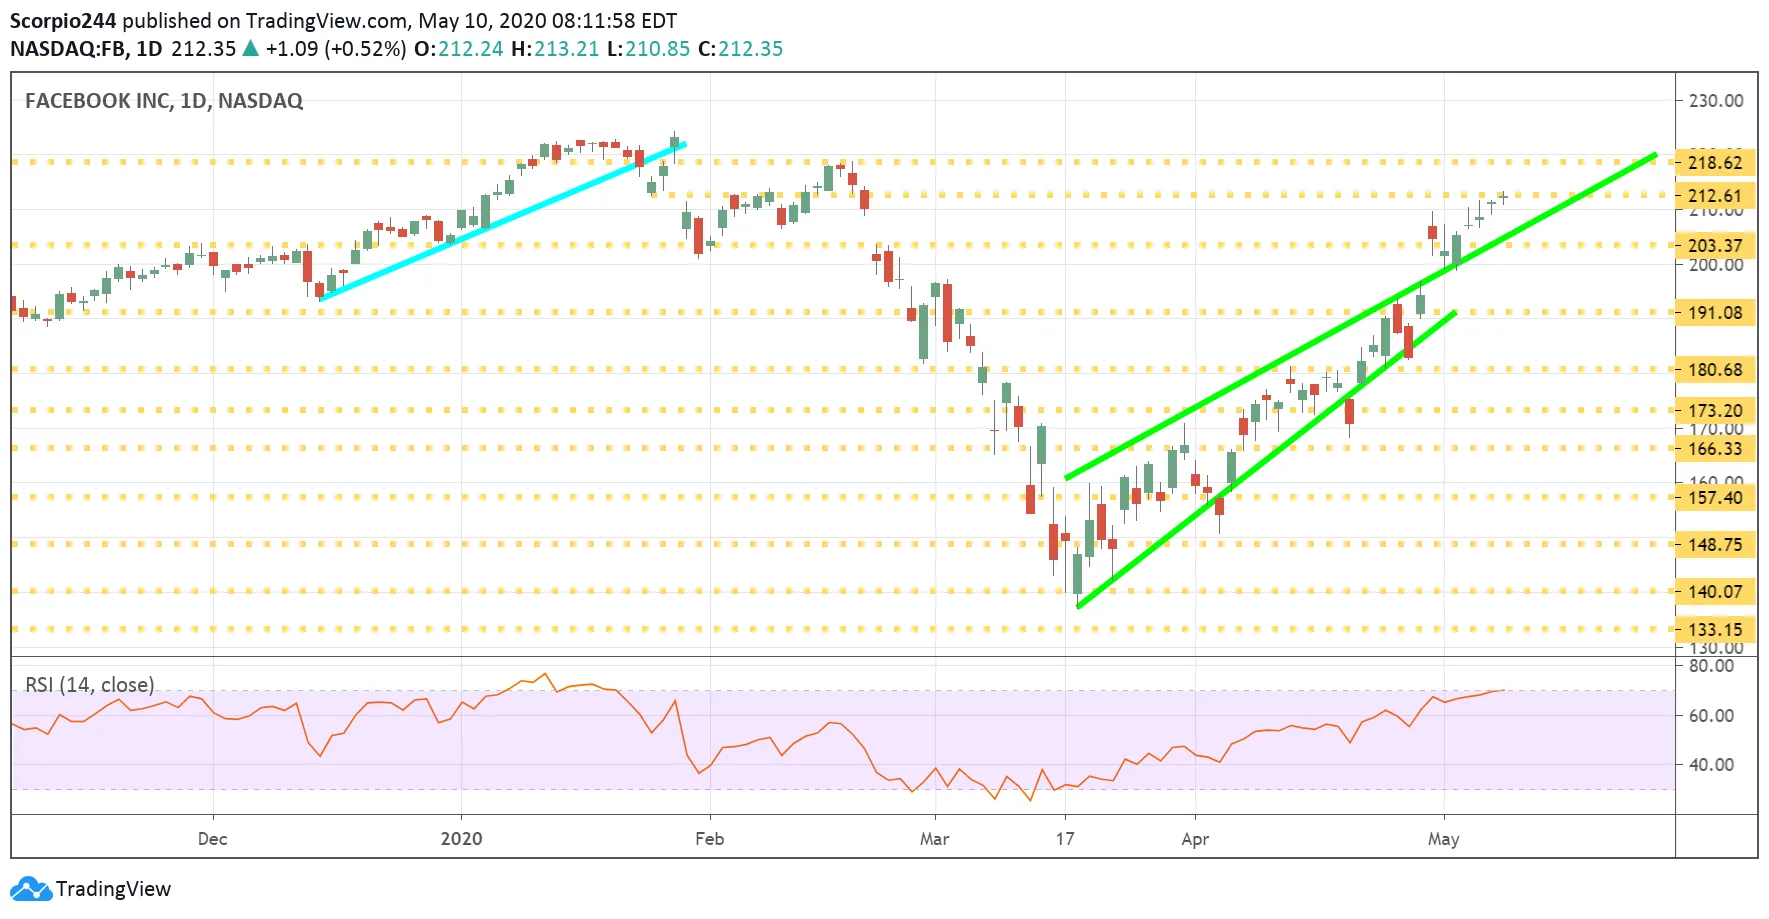
Facebook (NASDAQ:FB) has filled a gap too, and now its RSI is overbought with a reading of over 70. Not a good sign, as it means that stock is likely running out of steam, and reverse lower back to $191.
Facebook Inc Daily Chart

JD.com (JD)

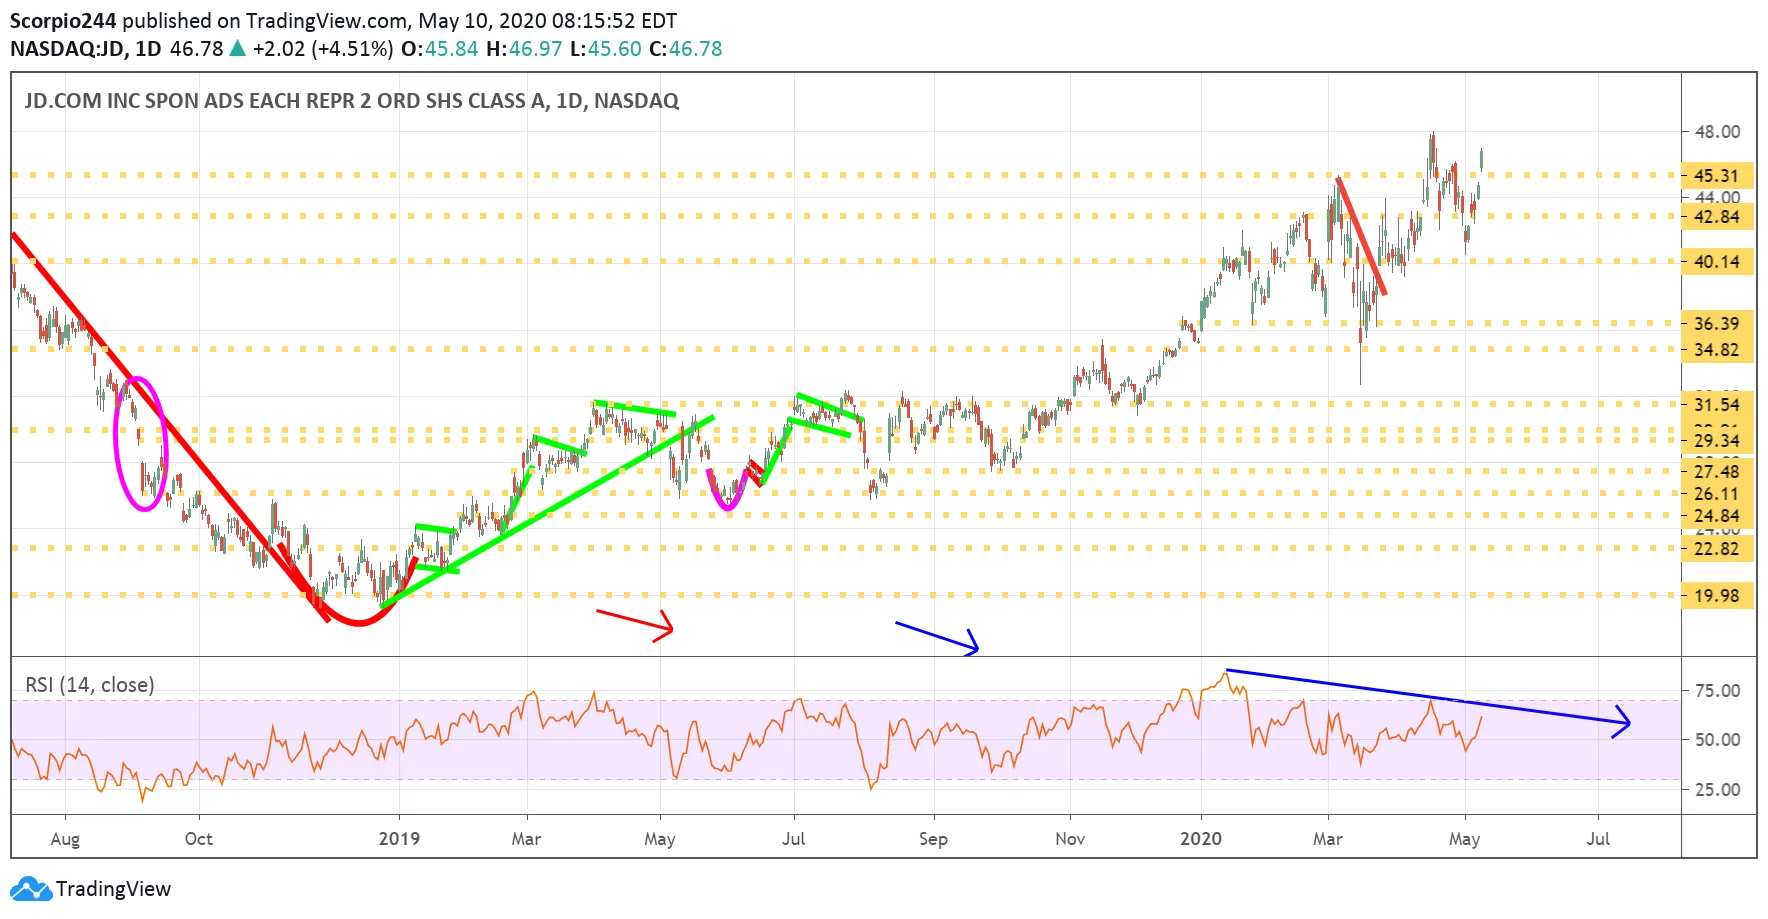
JD.com (NASDAQ:JD) is facing a bearish divergence on the RSI, and that means the stock may be topping out and on a path back to $42.80.
JD.com (JD) Daily Chart

Eli Lily (LLY)

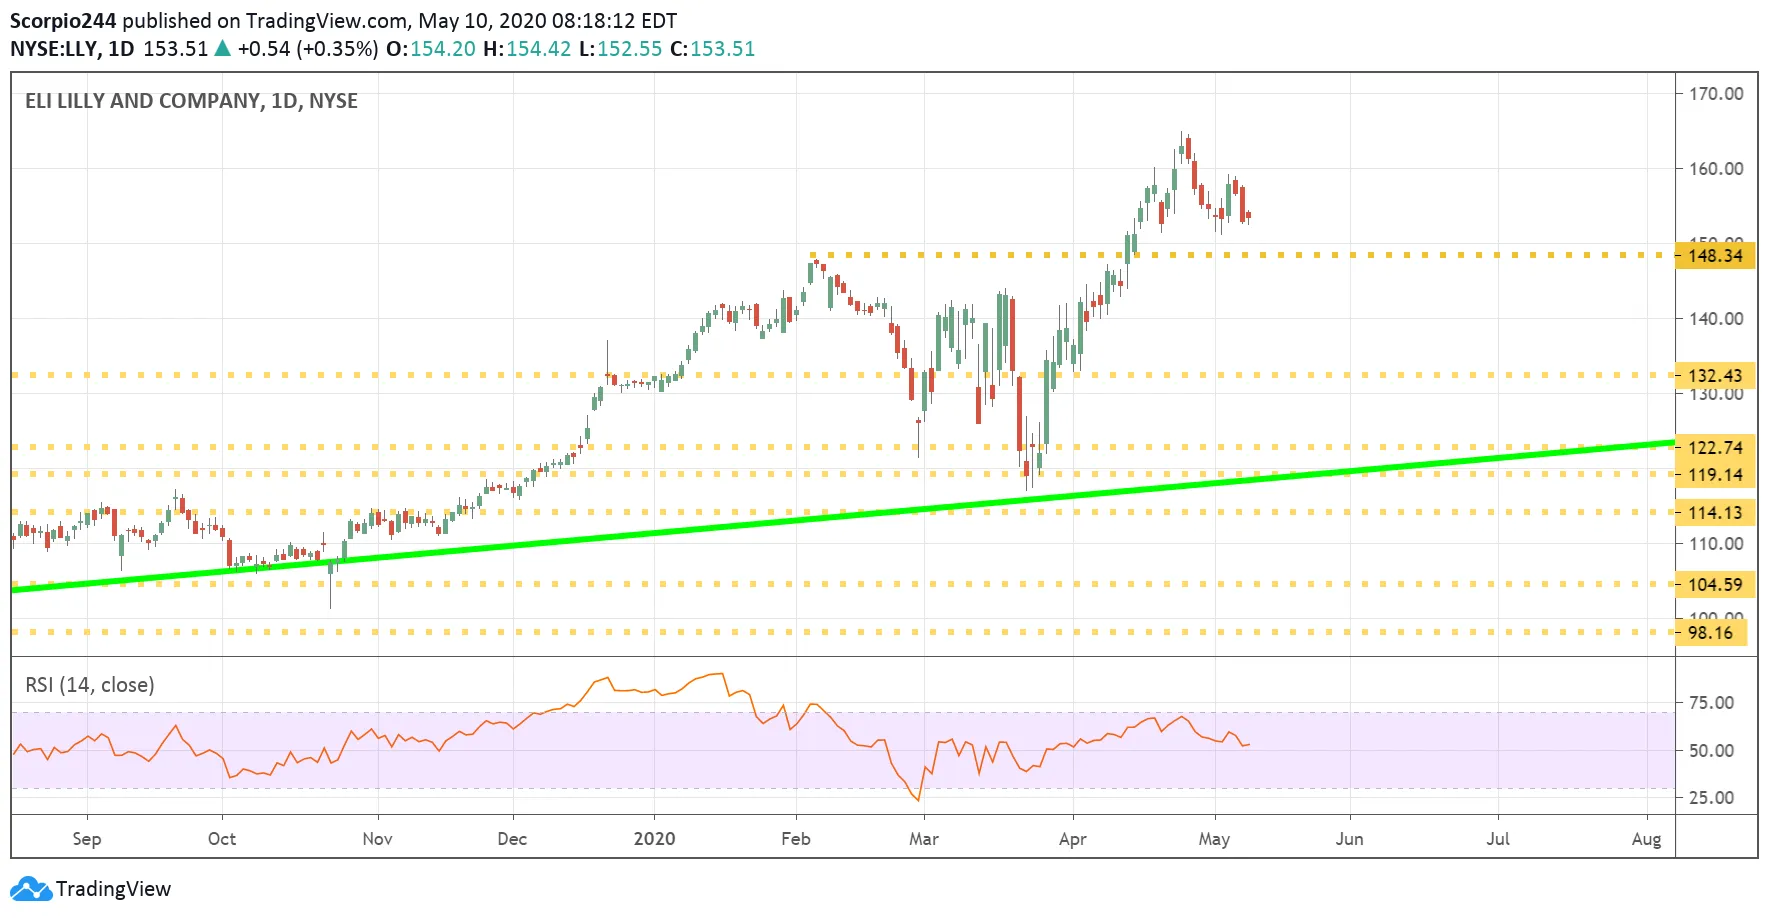
Eli Lilly (NYSE:LLY) may be forming a head and shoulders pattern, and the stock needs to fall below $152 to confirm the potentially significant reversal lower. The RSI is already telling you the stock is losing momentum.
Eli Lilly Co. Daily Chart

Amgen (AMGN)

Amgen (NASDAQ:AMGN) is also facing the same pattern as Lilly, with a drop below $224, confirming the reversal pattern.
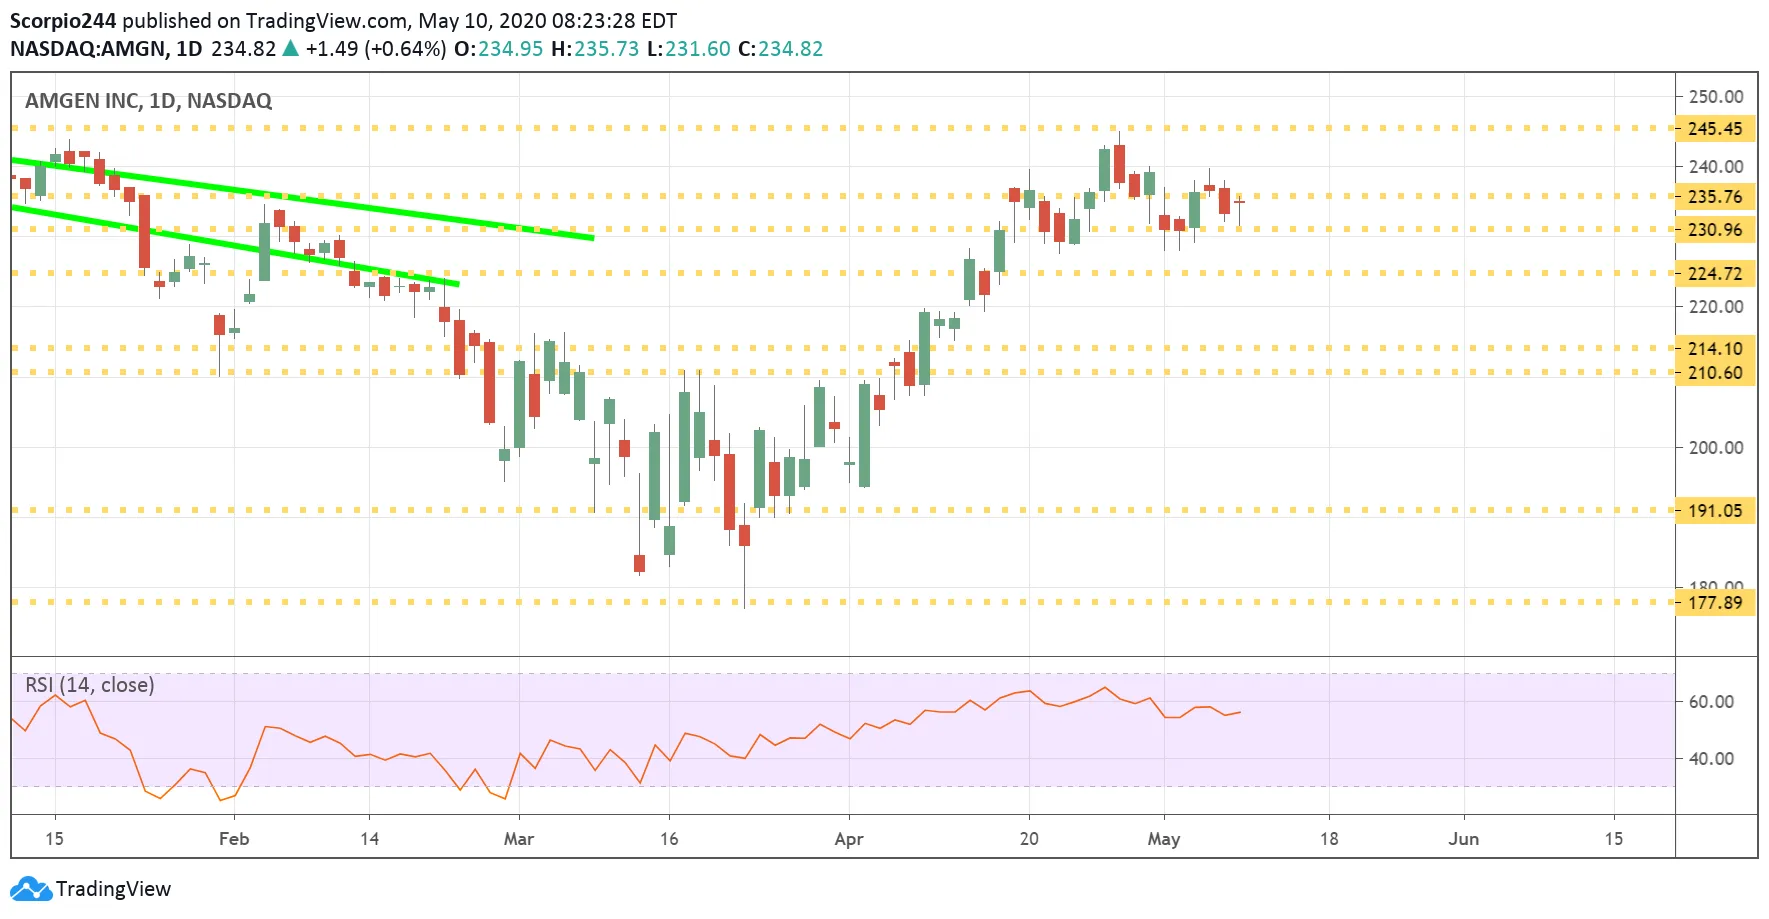
Amgen Inc Daily Chart

Original Post

Latest comments

I think you were a bit wrong about JD...besides it has an intrinsic value of $360
This guy has chsnged his stance so much. I dont think this stock will ever come down. 8 days of complete gping up..
Amzn, aple FB ,google,Microsoft are all super evaluate … they push spy to this hight … most of spy stock are still bellow 200 MVA … this is not good signal for all market
But when we invest in options.. weekly predciton matter. Everyone who was short is crying .. because they keep reading opinions that are based on inferior analysis. The bottom line is there is no way fo go for investors ans tje top tech stocks will just ocntinue to prop up and all short will loose moeny.
Risk Disclosure: Trading in financial instruments and/or cryptocurrencies involves high risks including the risk of losing some, or all, of your investment amount, and may not be suitable for all investors. Prices of cryptocurrencies are extremely volatile and may be affected by external factors such as financial, regulatory or political events. Trading on margin increases the financial risks.
Before deciding to trade in financial instrument or cryptocurrencies you should be fully informed of the risks and costs associated with trading the financial markets, carefully consider your investment objectives, level of experience, and risk appetite, and seek professional advice where needed.
Fusion Media would like to remind you that the data contained in this website is not necessarily real-time nor accurate. The data and prices on the website are not necessarily provided by any market or exchange, but may be provided by market makers, and so prices may not be accurate and may differ from the actual price at any given market, meaning prices are indicative and not appropriate for trading purposes. Fusion Media and any provider of the data contained in this website will not accept liability for any loss or damage as a result of your trading, or your reliance on the information contained within this website.
It is prohibited to use, store, reproduce, display, modify, transmit or distribute the data contained in this website without the explicit prior written permission of Fusion Media and/or the data provider. All intellectual property rights are reserved by the providers and/or the exchange providing the data contained in this website.
Fusion Media may be compensated by the advertisers that appear on the website, based on your interaction with the advertisements or advertisers.
© 2007-2024 - Fusion Media Limited. All Rights Reserved.