Get 40% Off
These stocks are up over 10% post earnings. Did you spot the buying opportunity? Our AI did.Read how

7 Monster Stock Market Charts Suggesting The Top May Be Very Close

Published 04/11/2021, 01:16 AM
Updated 09/20/2023, 06:34 AM

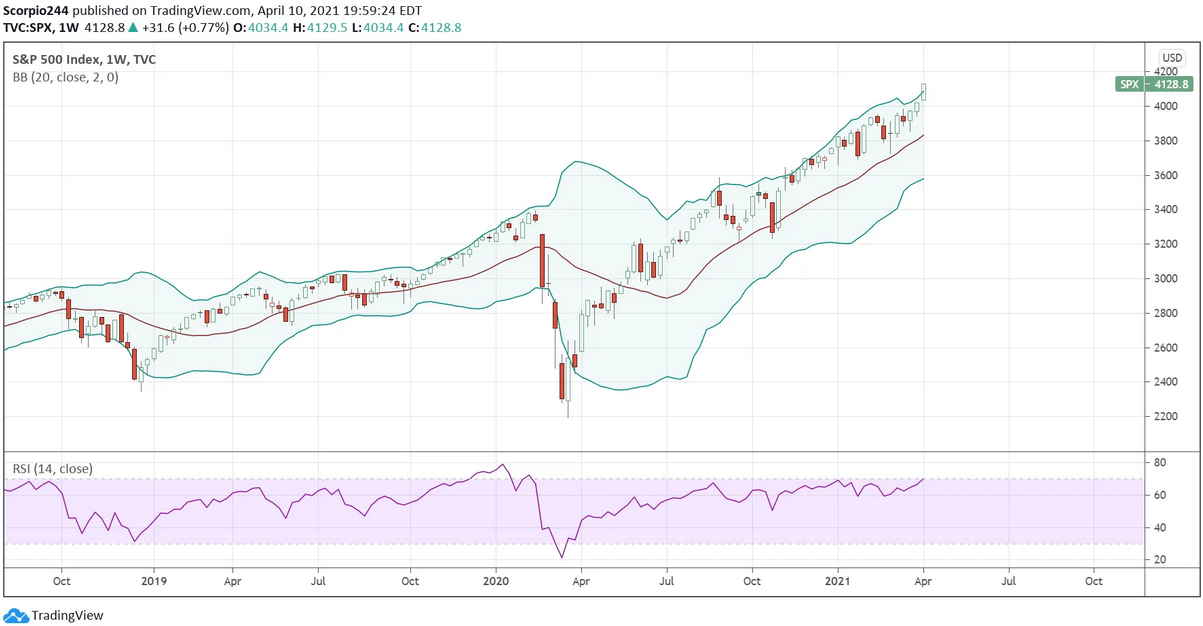
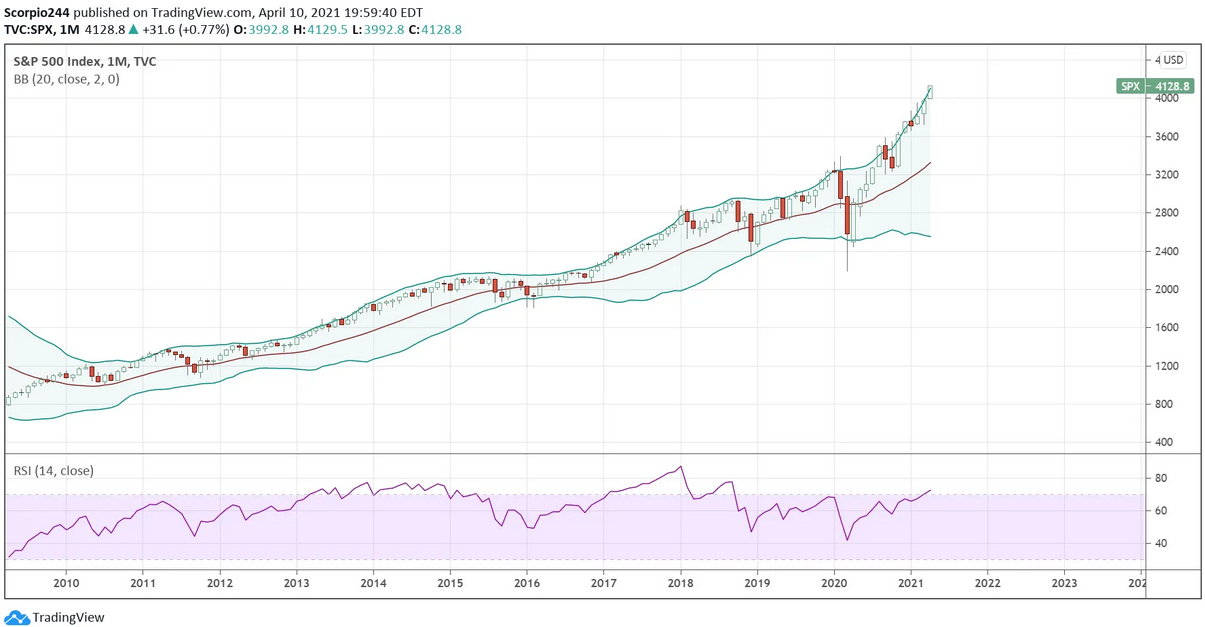
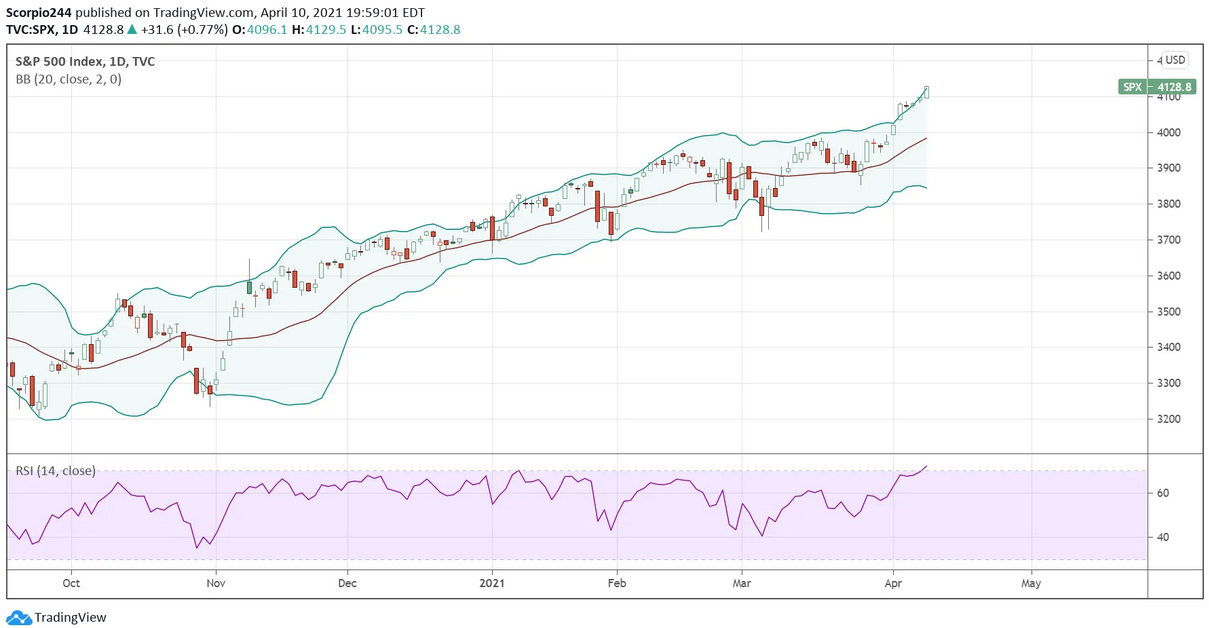
Anyway, another interesting week is upon us, and it isn’t often that we find the S&P 500 overbought, using the RSI and Bollinger Bands® on a Daily, Weekly, and Monthly basis all at the same time.

But that is exactly the case. Also, in this week’s video for readers of Reading The Markets, I review why I think the level around 4,130 on the SPX appears to offer a lot of technical resistance.

Daily
SPX  Daily Chart

Weekly

SPX Weekly Chart

Monthly

SPX Monthly Chart

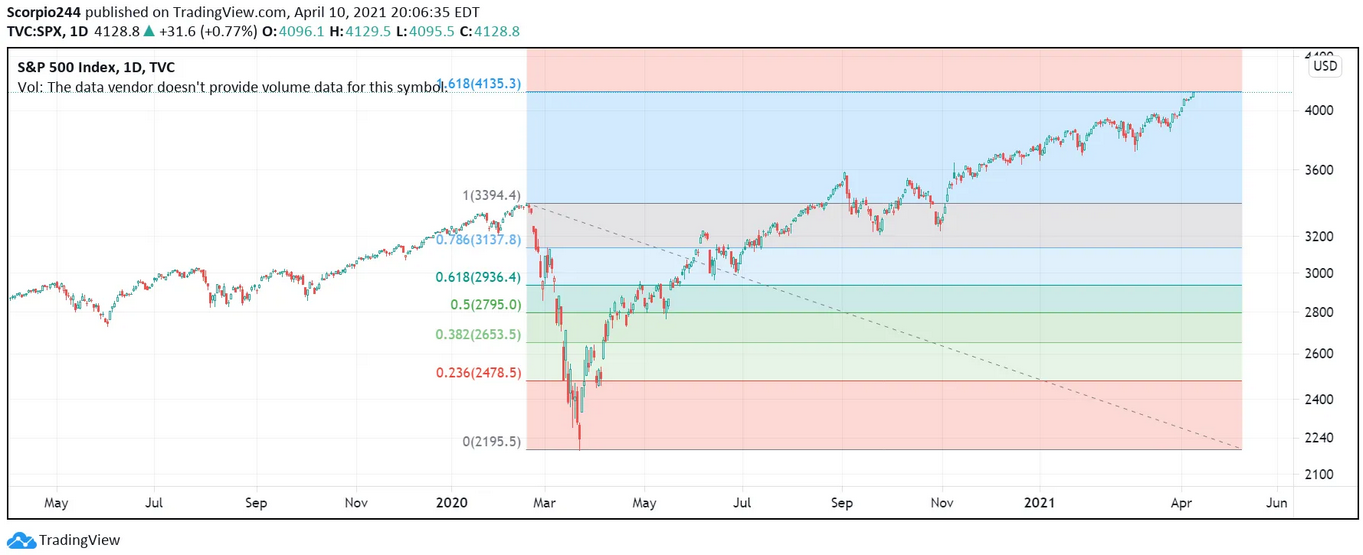
The chart below shows the S&P 500 now at the 1.618% extension from peak to trough of the March 2020 decline.
S&P 500 Daily Chart

There is also this chart that shows the 4,125 area as a 38.2% extension from the March low to the September peak.
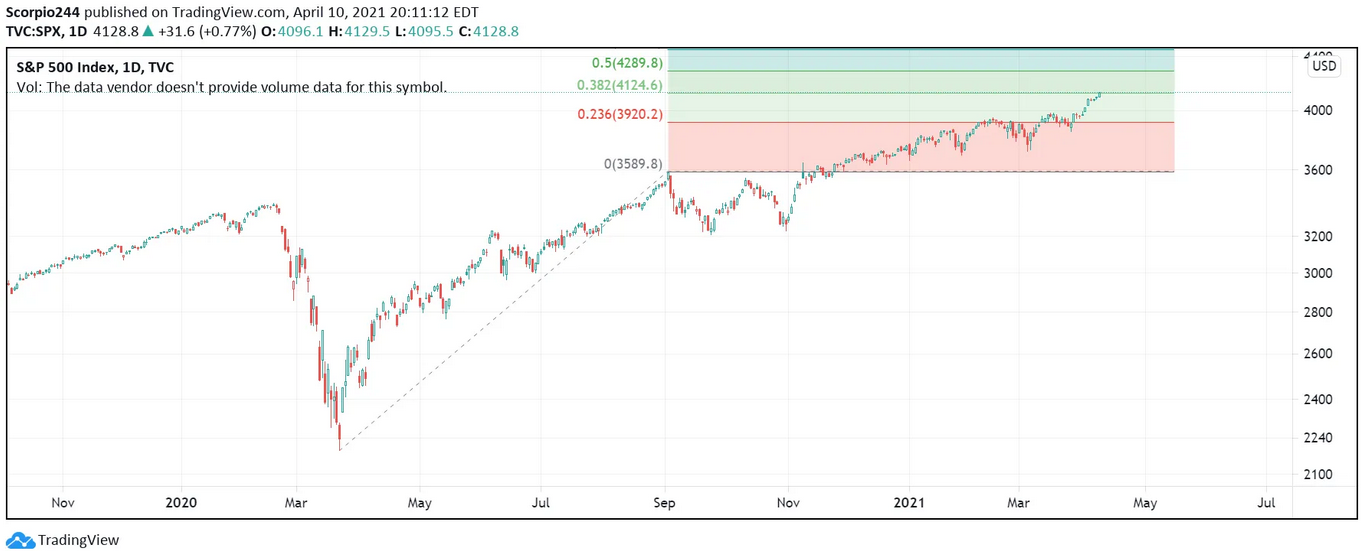
S&P 500 Daily Chart

This log chart shows the trading channel that has been in place since the 1920s and has only been violated 2 times—the late 1920s and the late 1990s. We are at the very upper end of the channel right now.
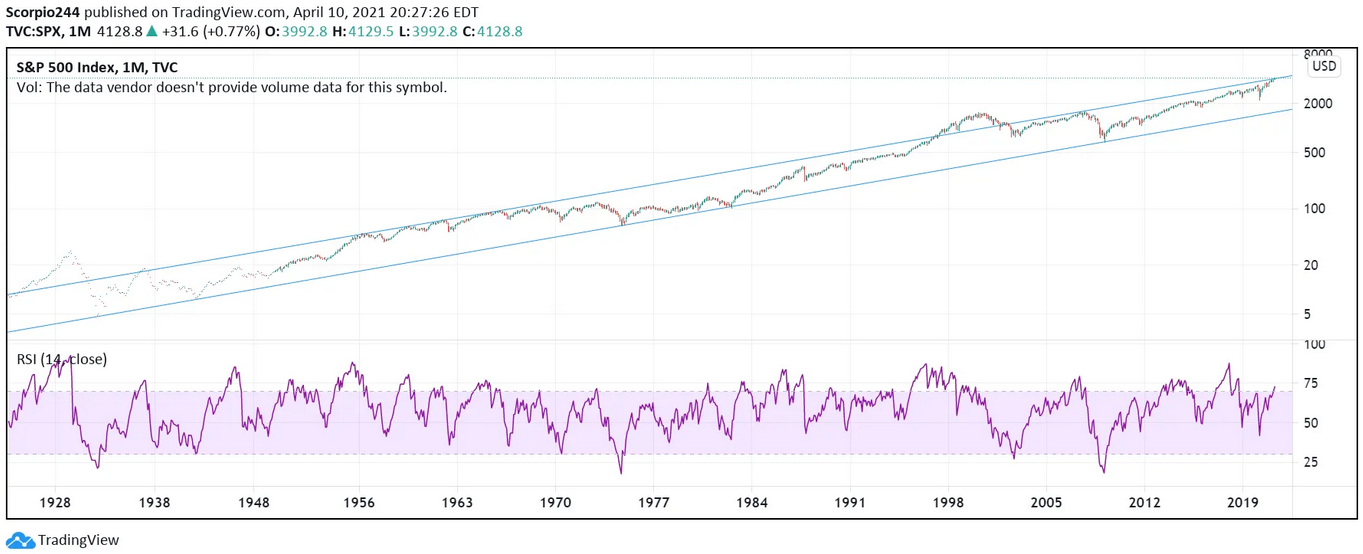
S&P 500 Index Monthly Chart

I stumbled upon this too, when I was looking at previous periods. I noticed the double bottom shape in April and May of 1987, which made me wonder what would happen if I overlaid 1986 and 1987 with 2020 and 2021. I got this…

I will tell you this the period of June 2020 until March 2021 is incredibly similar to November 1986 to October 1987. History may not repeat in the chart below, but it sure does rhyme.
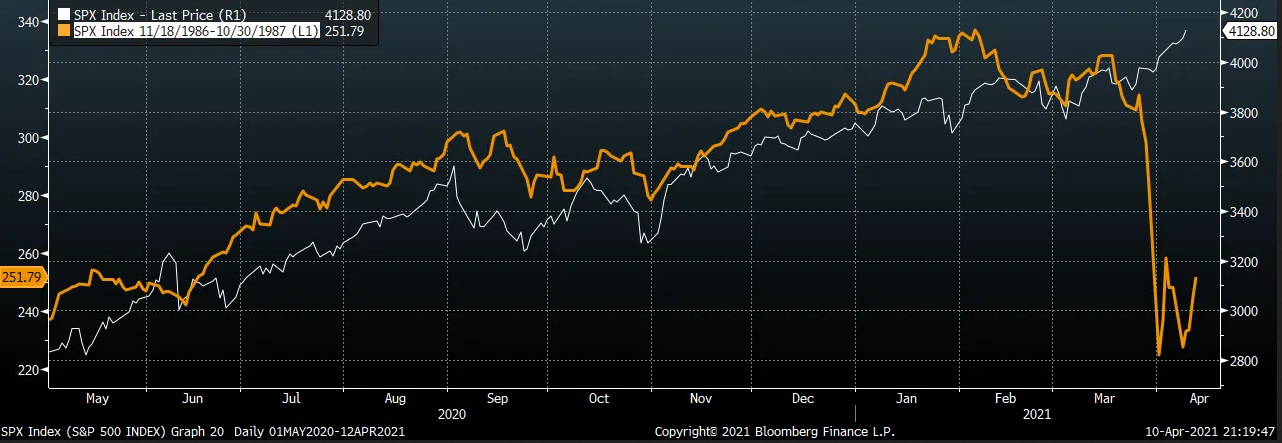
SPX Index Price - Daily Chart

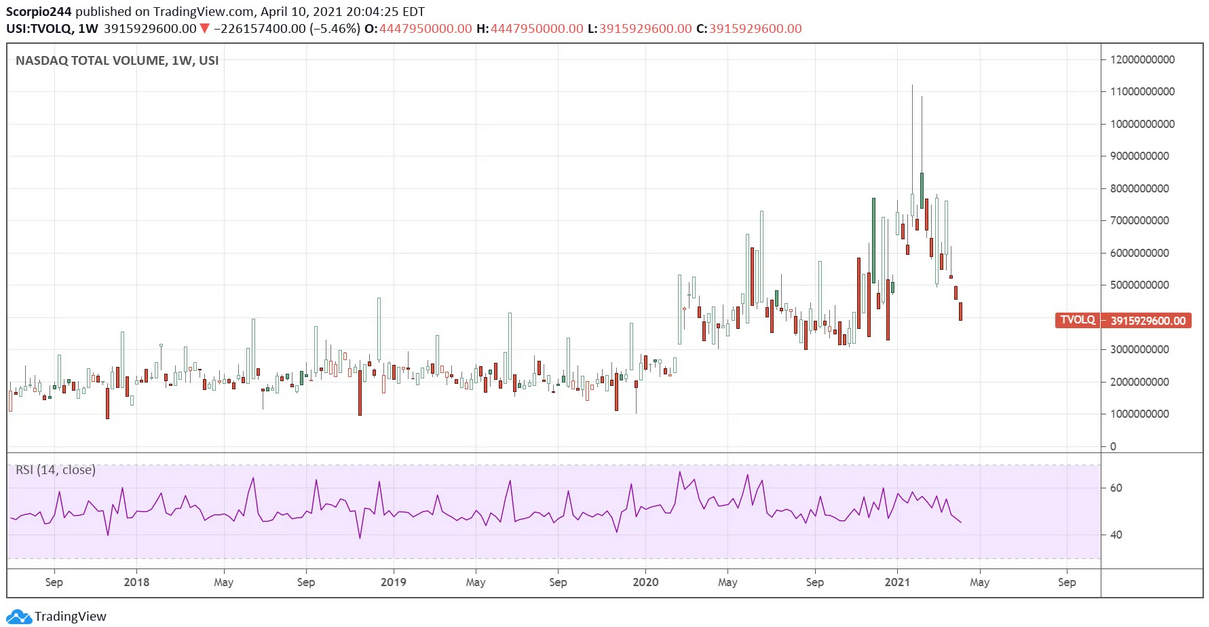
Finally, the market’s momentum is undeniable. Still, it appears to be occurring with fewer people participating, which means the market is not nearly as strong as it would seem, especially on the NASDAQ. It either suggests that sellers have taken a vacation and decided to let the buyers pay up, or there is a serious buyer exhaustion case.
3rd party Ad. Not an offer or recommendation by Investing.com. See disclosure here or remove ads .

NASDAQ Total Volume Weekly Chart

Anyway, that’s it for this week! I just thought I would change it up. Certainly something to think about.

Original Post

Latest comments

Very interesting analysis!
that and margin levels are beyond peaks and it's now unwind time.
Great analysis, thank you for sharing. Earnings or inflation numbers probably be the catalist for correction.
thank you.
Excellent analysis! Thank you! Inflation on tuesday will be the trigger. Lol
Good stuff Michael, thanks!
Thanks, Michael. Patience will be rewarded in the next 2-4 months. The best time to sell.
Thanks for this article that gives some hope..indeed the NASDAQ is performing bad, i have the impression that many investors especially in Biotech are changing orientation, getting rid of their shares at lower price and running to other sectors like big tech, infra and some industrial areas..which is to me a wrong approach..
Risk Disclosure: Trading in financial instruments and/or cryptocurrencies involves high risks including the risk of losing some, or all, of your investment amount, and may not be suitable for all investors. Prices of cryptocurrencies are extremely volatile and may be affected by external factors such as financial, regulatory or political events. Trading on margin increases the financial risks.
Before deciding to trade in financial instrument or cryptocurrencies you should be fully informed of the risks and costs associated with trading the financial markets, carefully consider your investment objectives, level of experience, and risk appetite, and seek professional advice where needed.
Fusion Media would like to remind you that the data contained in this website is not necessarily real-time nor accurate. The data and prices on the website are not necessarily provided by any market or exchange, but may be provided by market makers, and so prices may not be accurate and may differ from the actual price at any given market, meaning prices are indicative and not appropriate for trading purposes. Fusion Media and any provider of the data contained in this website will not accept liability for any loss or damage as a result of your trading, or your reliance on the information contained within this website.
It is prohibited to use, store, reproduce, display, modify, transmit or distribute the data contained in this website without the explicit prior written permission of Fusion Media and/or the data provider. All intellectual property rights are reserved by the providers and/or the exchange providing the data contained in this website.
Fusion Media may be compensated by the advertisers that appear on the website, based on your interaction with the advertisements or advertisers.
© 2007-2024 - Fusion Media Limited. All Rights Reserved.