Get 40% Off
🚨 Volatile Markets? Find Hidden Gems for Serious Outperformance
Find Stocks Now

6 Stock Market Predictions For The Week Of June 1

Published 05/31/2021, 04:51 PM
Updated 09/20/2023, 06:34 AM

This week will be jam-packed, with just four trading days for the ISM PMIs and jobs data. It means there could be some extra volatility this week. The index didn’t have a great finish to last week, and we made an end-of-day move higher in the VIX index on Friday, which would suggest that some trades may have been trying to put on some last minute hedge positions ahead of this week’s data deluge.
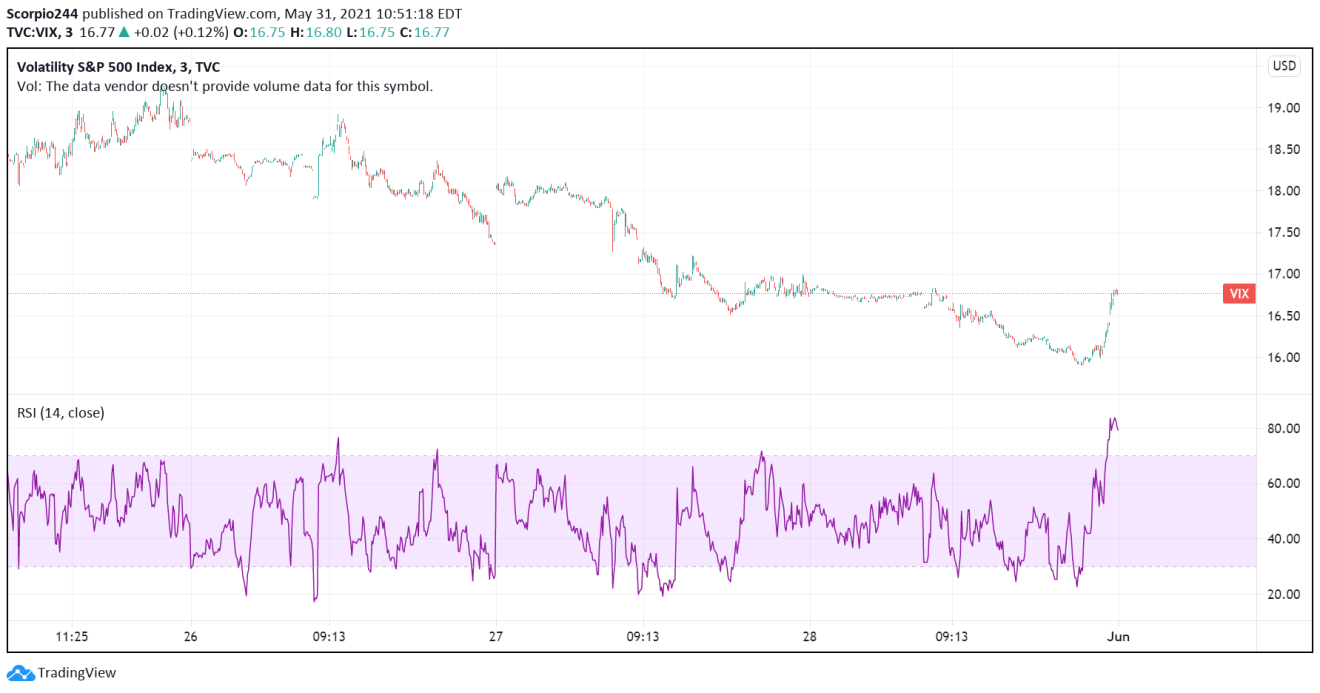
VIX Chart.

S&P 500 (SPY)

The S&P 500 Futures were trading lower by around 20 bps on May 31, following last Friday’s end-of-day dive. It is likely that this week we head lower and close some of those gaps from last week’s rally. There is now a clear ABC pattern in the futures that was less clear before Friday. It would suggest a pullback to either 4,180 or perhaps as low as 4,120.
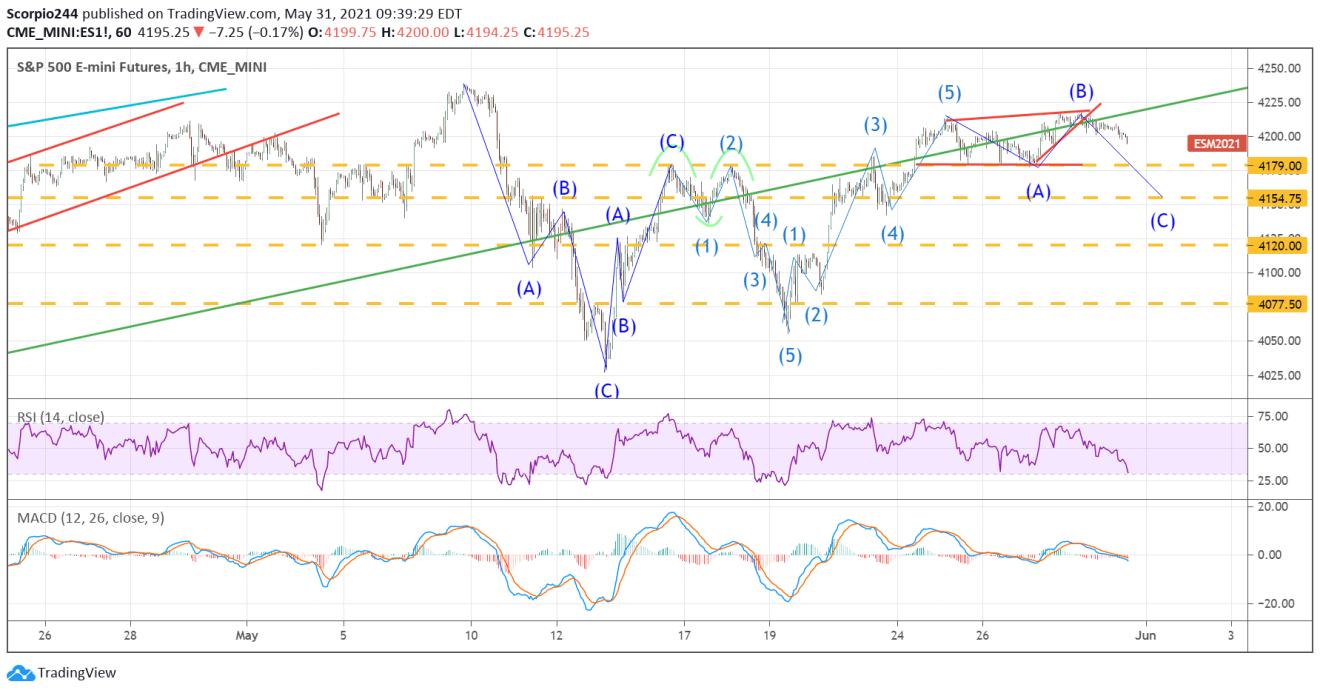
S&P 500 E-Mini Futures Hourly Chart

Gamma

Gamma levels for the S&P 500 are still at 4,200, with the next major level down at 4,150. It means that 4,200 will continue to act as a magnet this week. If it starts drifting too far from that level, puts will take over, and that will push the S&P 500 towards 4,150.
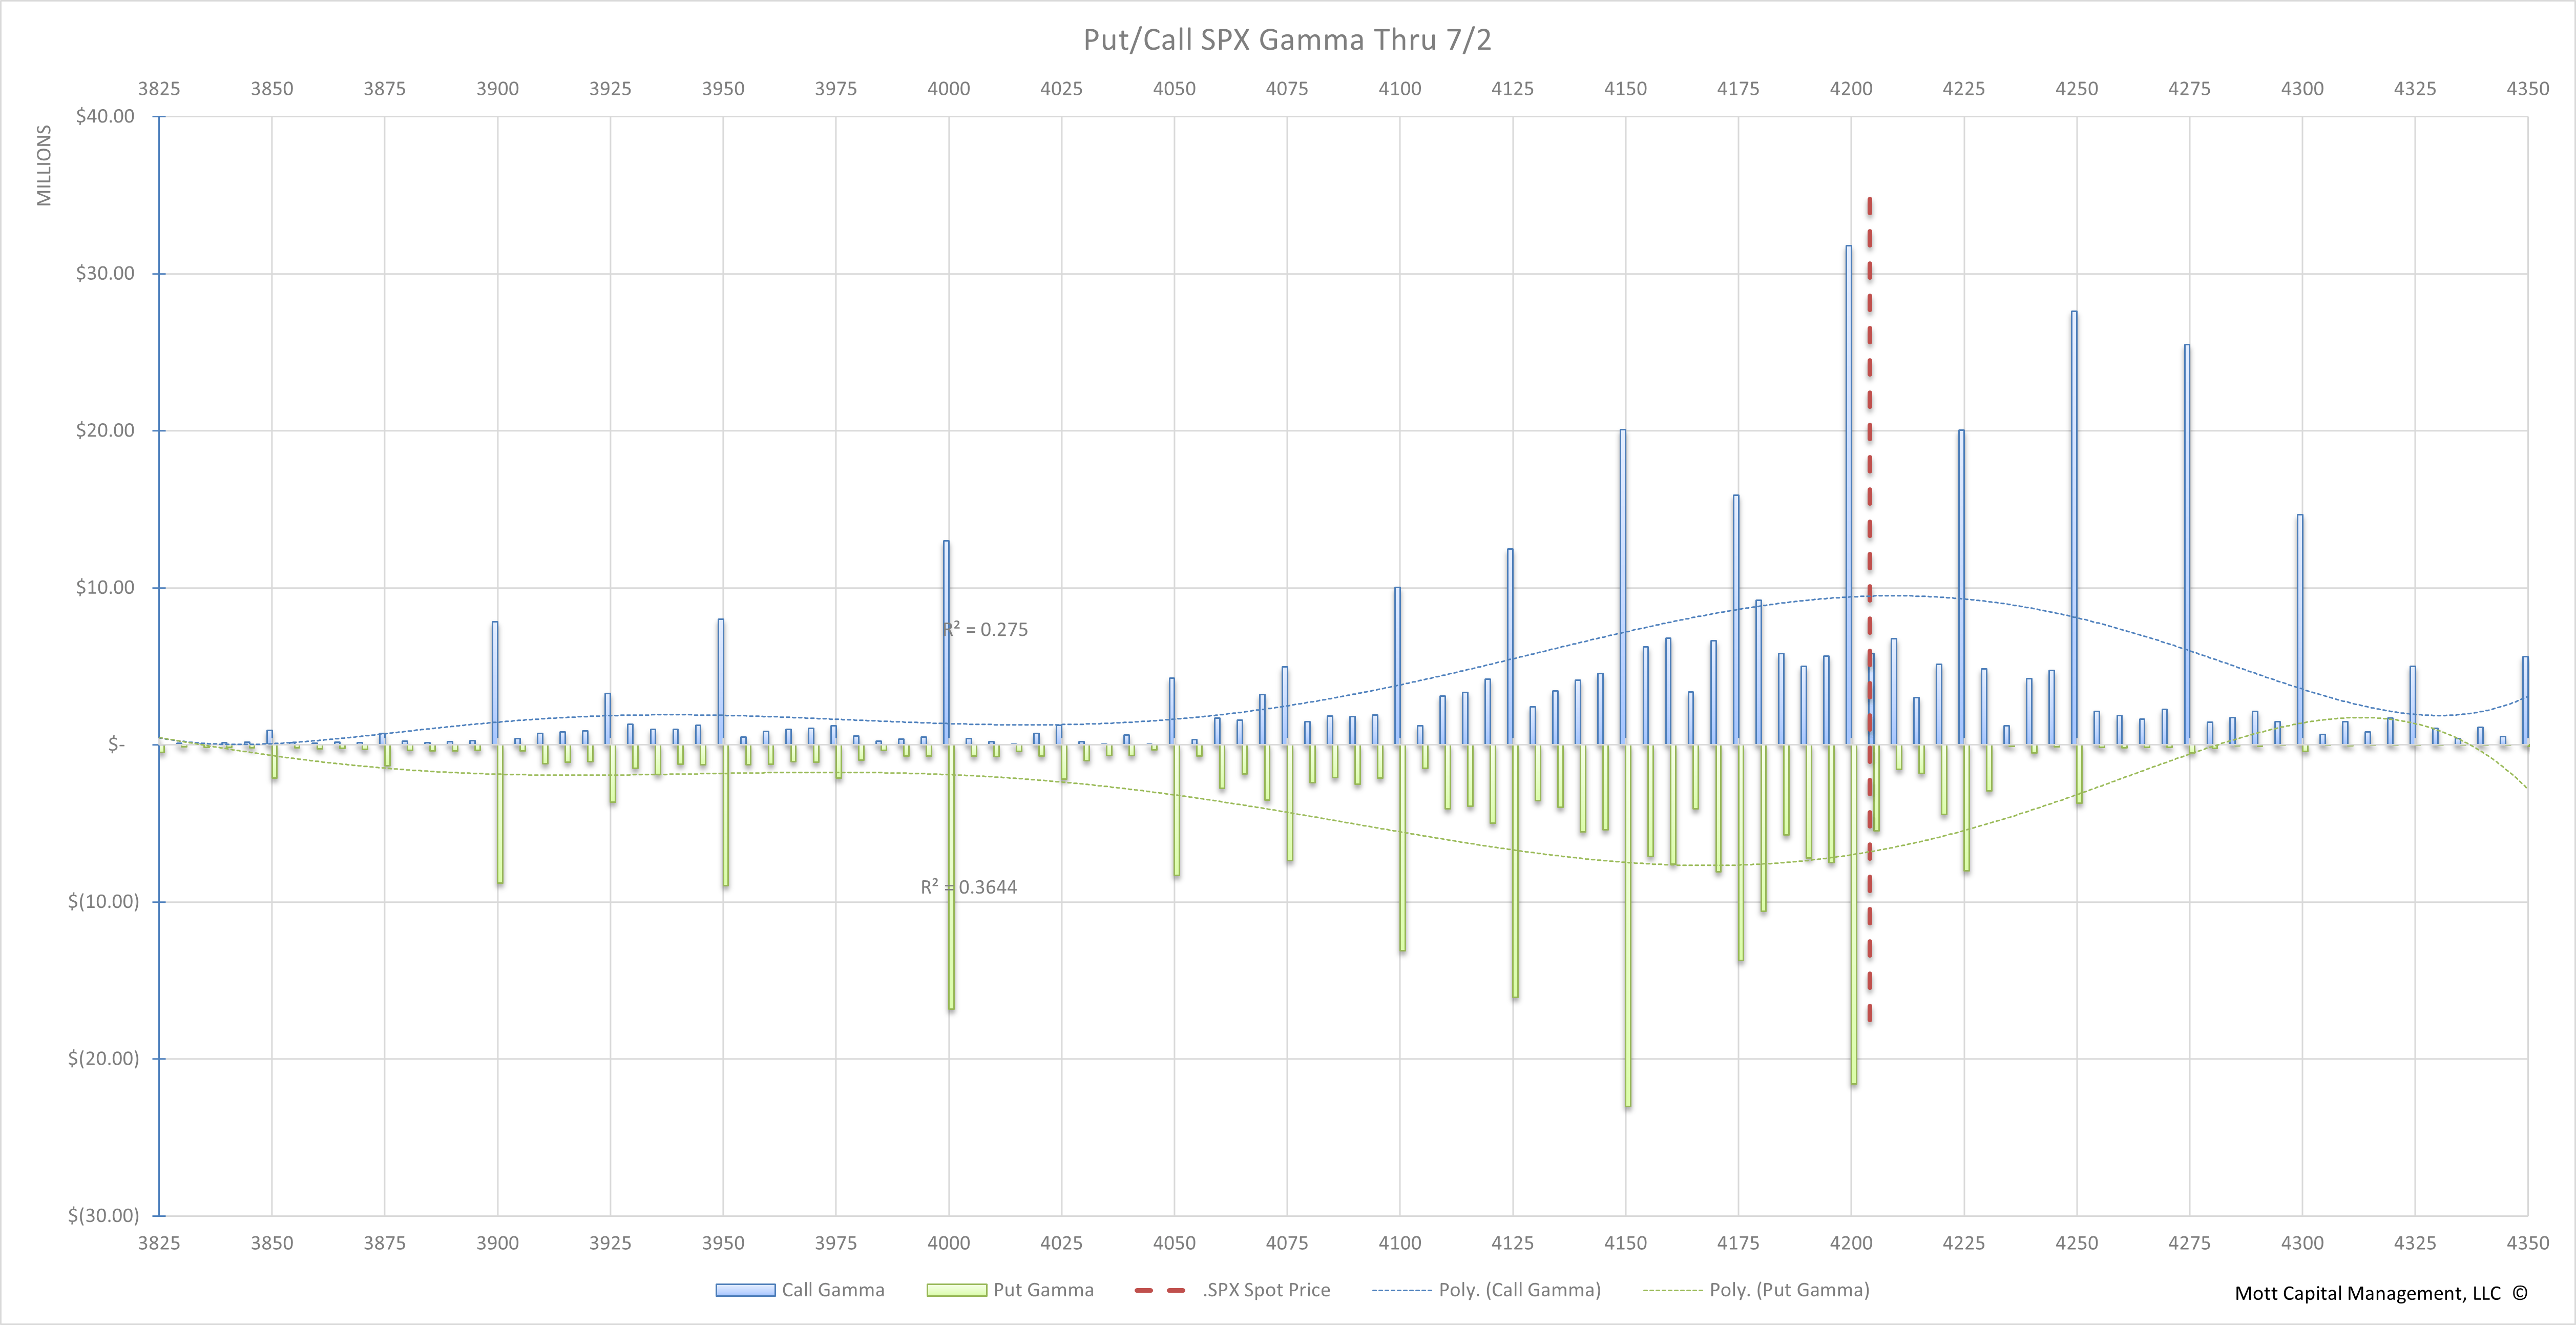
Put-Call Gamma Chart.

Wedge Pattern

There is a massive rising wedge pattern forming in the S&P 500 on the daily chart, with a clear bearish divergence forming on the relative strength index.
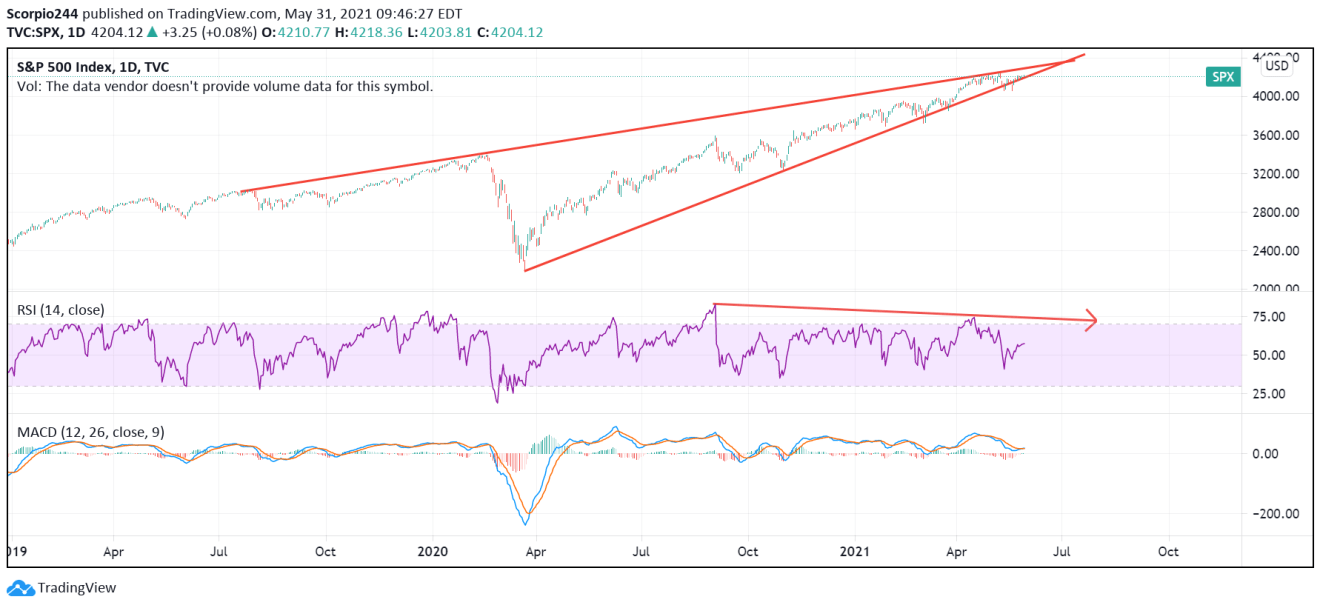
S&P 500 Daily Chart.

The problem is that pattern grows even worse when you look at it on a weekly chart. You can clearly see the bearish divergence (rising prices, falling RSI) on the weekly RSI, with it starting all the way back in January of 2018 and connecting with January 2020 and now. Additionally, as of last week, you can see that the MACD was now converging and very close to crossing over one another.

3rd party Ad. Not an offer or recommendation by Investing.com. See disclosure here or remove ads .

The index is already flirting with the low end of the uptrend, and a meaningful break of the lower trend could easily send the index off to a lower direction. It is not to say that we are about to enter some grand bear market, but the last time we had a major setup like this was in the fall of 2018.

The setup could easily suggest that we see a decline in the order of 10-15%, or even 15-20%. The same thing happened between 2010 and 2012, and there is no reason it could happen again at this point in the cycle. 
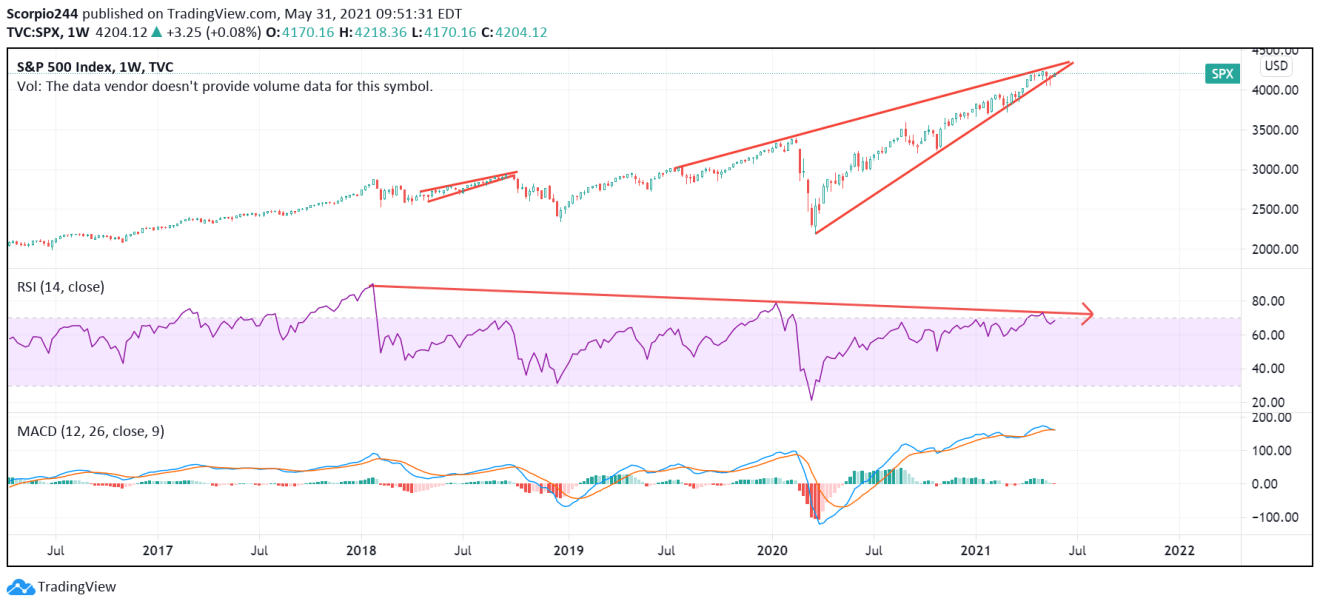
S&P 500 Weekly Chart.

JPMorgan

Financials have been in a market leader over the past several weeks, and JPMorgan (NYSE:JPM) has a diamond pattern forming, a bearish pattern. The RSI is trending lower, and the MACD is crossing over. Support for the stock comes at $157, with a break below $157, sending the shares lower towards $146.
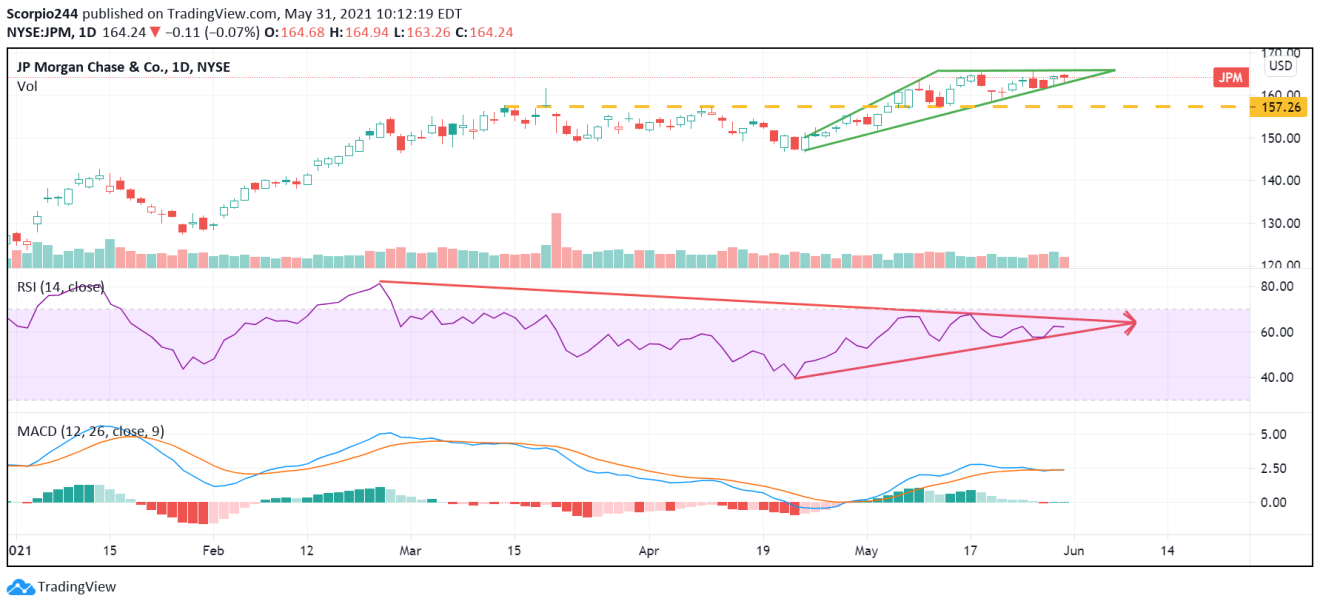
JP Morgan Chase Daily Chart.

Exxon

Exxon (NYSE:XOM) has been the leading energy stock, and it, too, has had its struggles. We wait to see if the stock breaks support at $54.50. If it does, it is likely to seal the deal on a double top, bringing out steeper declines.
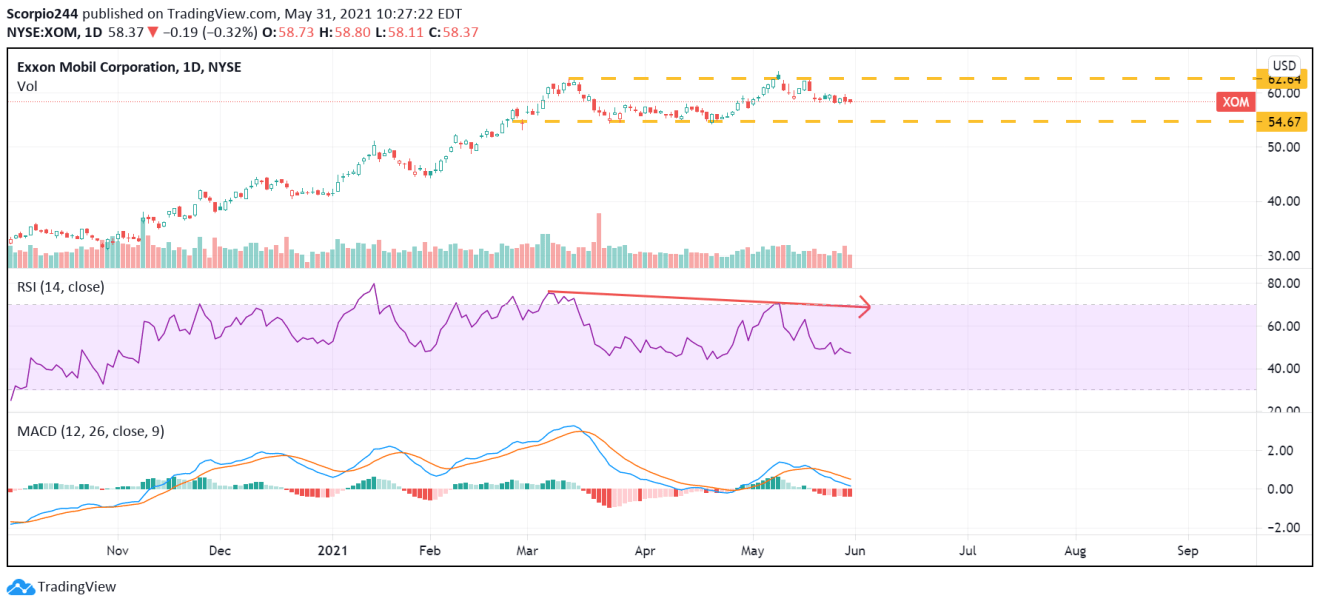
Exxon Mobil Daily Chart.

Netflix

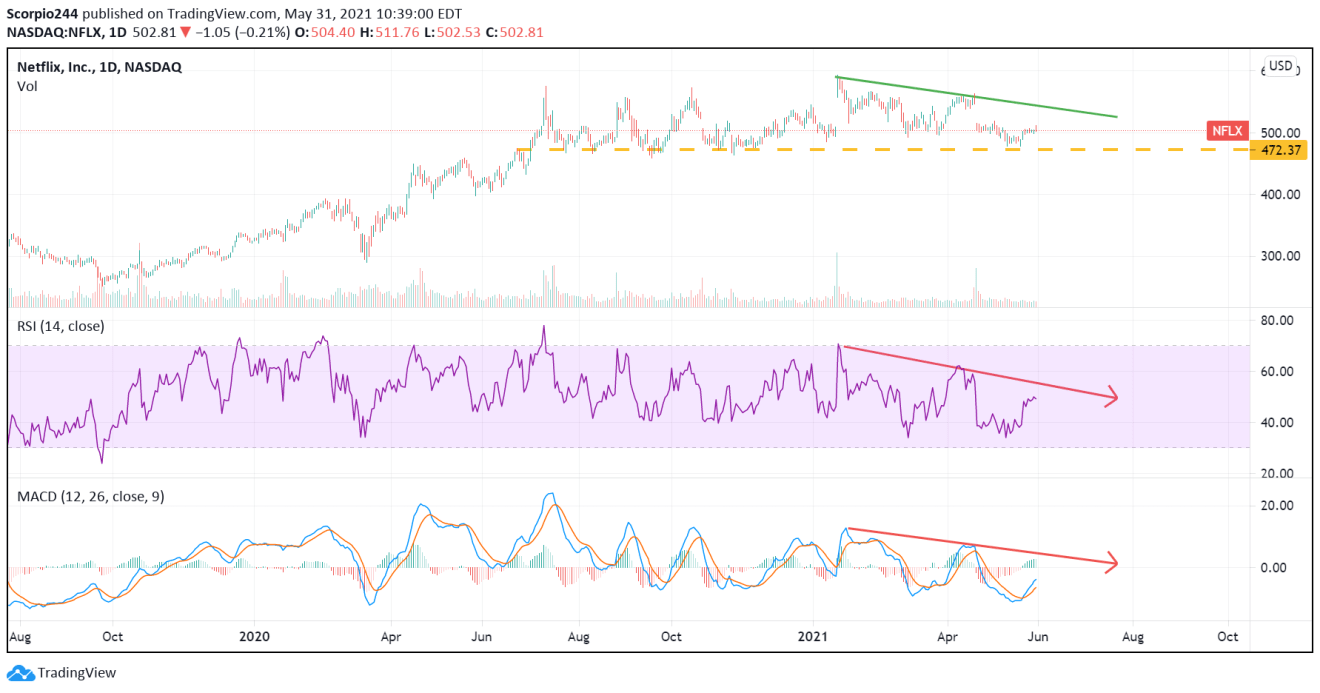
Netflix (NASDAQ:NFLX) has been flirting with this $470 to $490 level for some time, and no matter how good earnings have been, the market has not been able to push it higher. The momentum indicators are all trending lower, and I think it may only be a matter of time before the stock finally breaks down.
3rd party Ad. Not an offer or recommendation by Investing.com. See disclosure here or remove ads .

Netflix Daily Chart.

Ford

Last week, I noted Ford (NYSE:F) saw massive bearish puts trades being placed. The equity is completely overbought, and I don’t see why it couldn’t trade back to $13.40 for starters. 
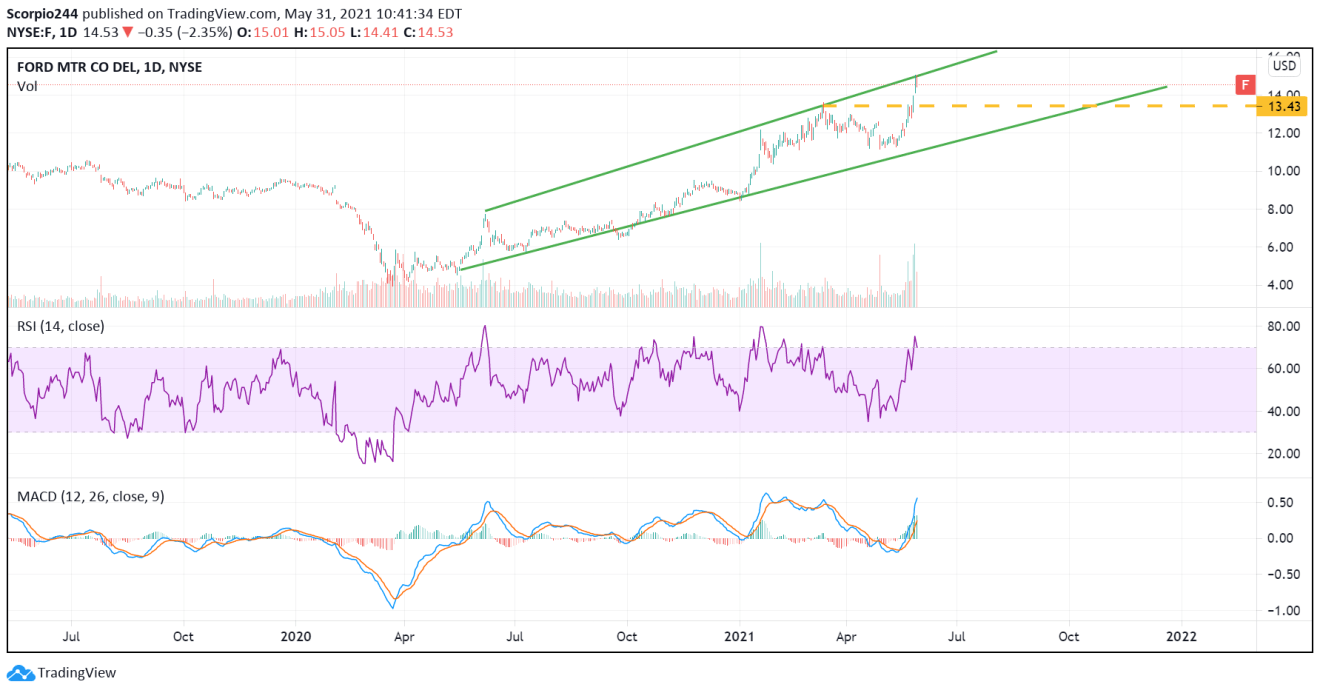
Ford Daily Chart.

GE

General Electric (NYSE:GE) may have broken out, with that giant cup-and-handle pattern, and potential path higher towards $16.70. This stock was seeing a lot of bullish call option activity last week. 
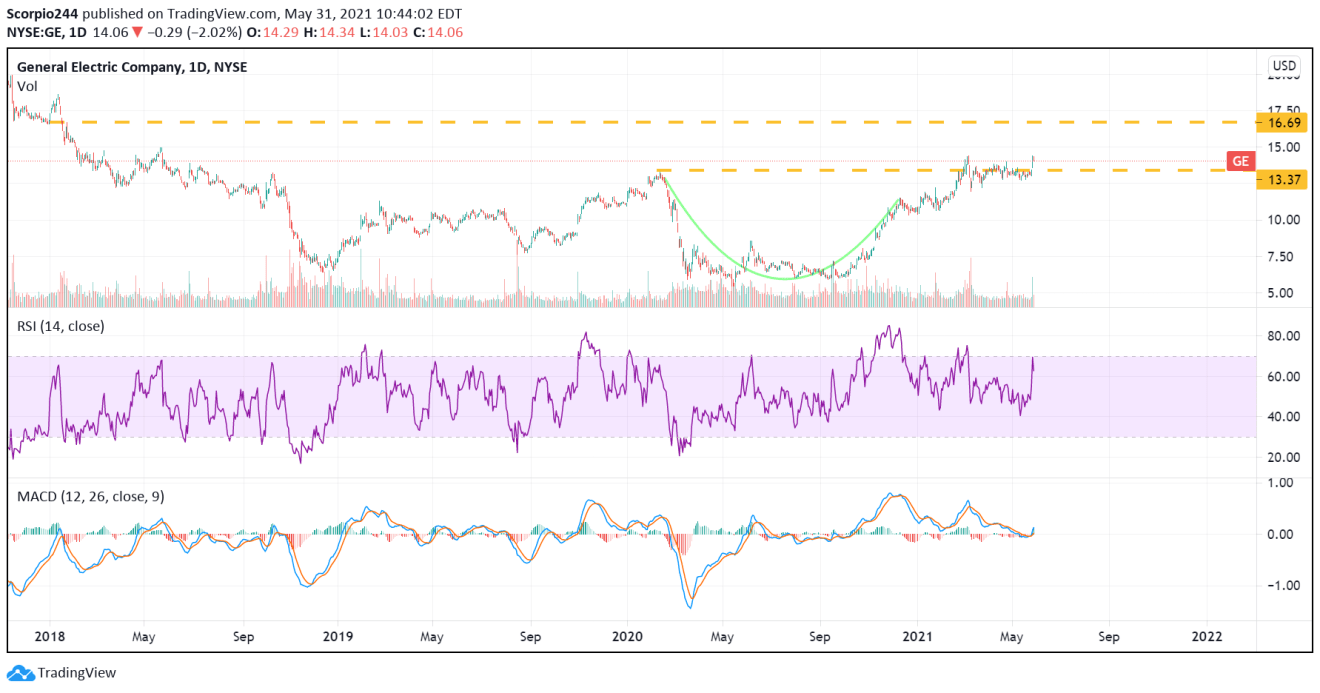
General Electric Daily Chart.

Latest comments

I consider, Investing.com should only publish articles from Finantial Experts that lives in this planet.
hi
lol expert advice 🤣 😆2yr finance degree Mike?
hi
my name is Helen I am from United States
No way!! Nice try though! In worst case, market just move sideways for another week,but mostly NOT going to give up 4200 levels quickly!!
Haha. No. This market is headed much higher. Economies are soaring. Demand for products and energy will be huge. I like energy, materials, and tech. This is not a time to be cautious. You should be fully invested.
it will go up until 6 June amd then a nice correction
The spy needs a major correction and is so over bought its gross. Yet with the neverending pockets of J. Pow Pow who knows when or if a correction can/will happen.
Hi
my name is Helen
Thanks Michael! Looking forward to adding a few more JPM puts tomorrow
Prediction?Pain.
thx!
Great analysis. Thank you for insite
Risk Disclosure: Trading in financial instruments and/or cryptocurrencies involves high risks including the risk of losing some, or all, of your investment amount, and may not be suitable for all investors. Prices of cryptocurrencies are extremely volatile and may be affected by external factors such as financial, regulatory or political events. Trading on margin increases the financial risks.
Before deciding to trade in financial instrument or cryptocurrencies you should be fully informed of the risks and costs associated with trading the financial markets, carefully consider your investment objectives, level of experience, and risk appetite, and seek professional advice where needed.
Fusion Media would like to remind you that the data contained in this website is not necessarily real-time nor accurate. The data and prices on the website are not necessarily provided by any market or exchange, but may be provided by market makers, and so prices may not be accurate and may differ from the actual price at any given market, meaning prices are indicative and not appropriate for trading purposes. Fusion Media and any provider of the data contained in this website will not accept liability for any loss or damage as a result of your trading, or your reliance on the information contained within this website.
It is prohibited to use, store, reproduce, display, modify, transmit or distribute the data contained in this website without the explicit prior written permission of Fusion Media and/or the data provider. All intellectual property rights are reserved by the providers and/or the exchange providing the data contained in this website.
Fusion Media may be compensated by the advertisers that appear on the website, based on your interaction with the advertisements or advertisers.
© 2007-2024 - Fusion Media Limited. All Rights Reserved.