With the release of the June quarter GDP results from China it's worth checking in on a few charts that show some of the key trends in China's economy. The charts present mostly a cyclical view, but the structural trends and changes in the make up of the economy are also clearly evident in the graphs below.
The high level takeaways are that China has engineered a cyclical rebound in nominal and real GDP growth, with a big turnaround in the GDP deflator driven by commodities. The "old-China" secondary sector has been a big driver of the rebound, but it's worth noting the "new-China" tertiary/services sector is now the dominant part of the economy and will likely continue to grow in importance.
In terms of the outlook, there is still some upside in the current stimulus-driven cyclical economic upturn through the end of this year, but 2018 will probably be a more difficult year for China's economy vs 2017.
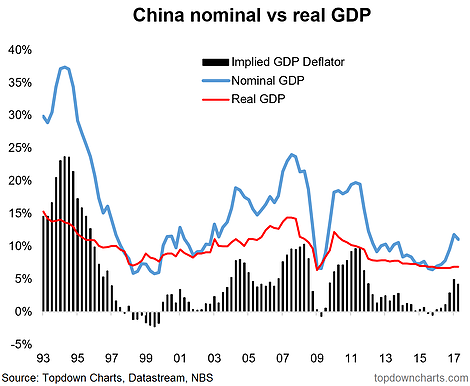
1. First up a look at headline nominal vs real GDP growth for China and the implied GDP deflator. The surge in nominal growth/the deflator has been the big story for China...
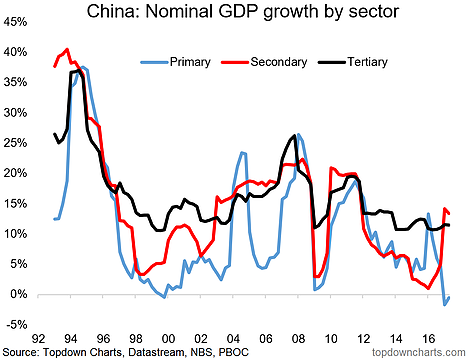
2. And here is nominal GDP growth across the 3 main sectors (basically: primary = agriculture/extraction, secondary = manufacturing and industry, tertiary = services). Notice the surge in the traditional growth driver of China's economy - the secondary sector. This comes after the worst growth numbers for that sector on record... you could say the secondary sector went through a hard landing in 2015/16.
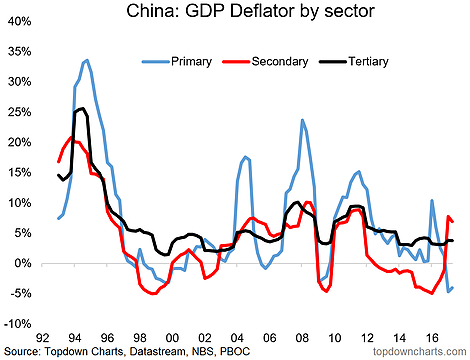
3. Looking through at the GDP deflators by sector you can see it's the secondary sector, and a lot of that actually had to do with commodity prices, so the sustainability or 'realness' of it is worth questioning.
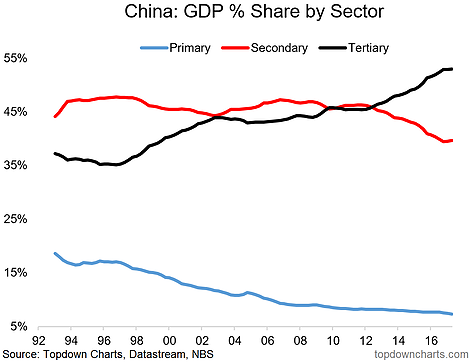
4. On the topic of the major sectors, here's a view of the % share of GDP. The much fabled transition to a service based economy (from manufacturing and exports) is apparently well under way. The tertiary/services sector of the economy is comfortably the largest part of China's economy and there is probably still some upside in this.
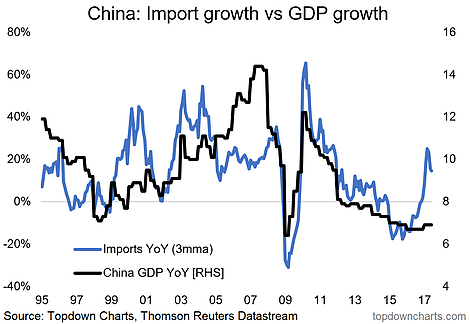
5. Notice how Chinese imports slowed along with GDP growth, again the rebound is overstated by commodity prices, but it's probably still roughly the right direction as the stimulus push has been effecting in engineering a cyclical rebound.
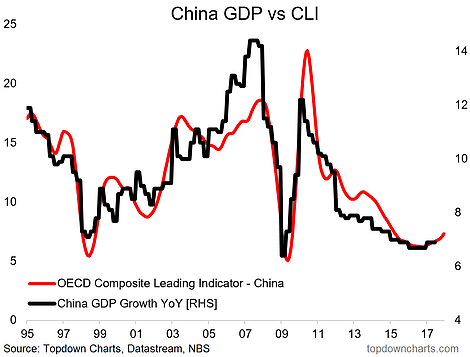
6. While it only provides a 4-6 month lead (which can be super useful at turning points) the OECD Composite Leading Indicator for China is pointing to slightly stronger GDP growth in the next quarter or two. However, 2018 will be more challenging than 2017 as we have previously discussed.
