
The S&P 500 E-mini futures broke below the 9-month trading range this week, and E-mini weak breakout, but closed as a reversal bar with a bear body and a long tail below. The selling has been climactic. The bulls hope that a 2 legged sideways to up pullback will begin soon. The bears will need to create another bear bar to confirm the breakout below the trading range.
S&P 500 E-mini futures
The Weekly S&P 500 E-mini chart
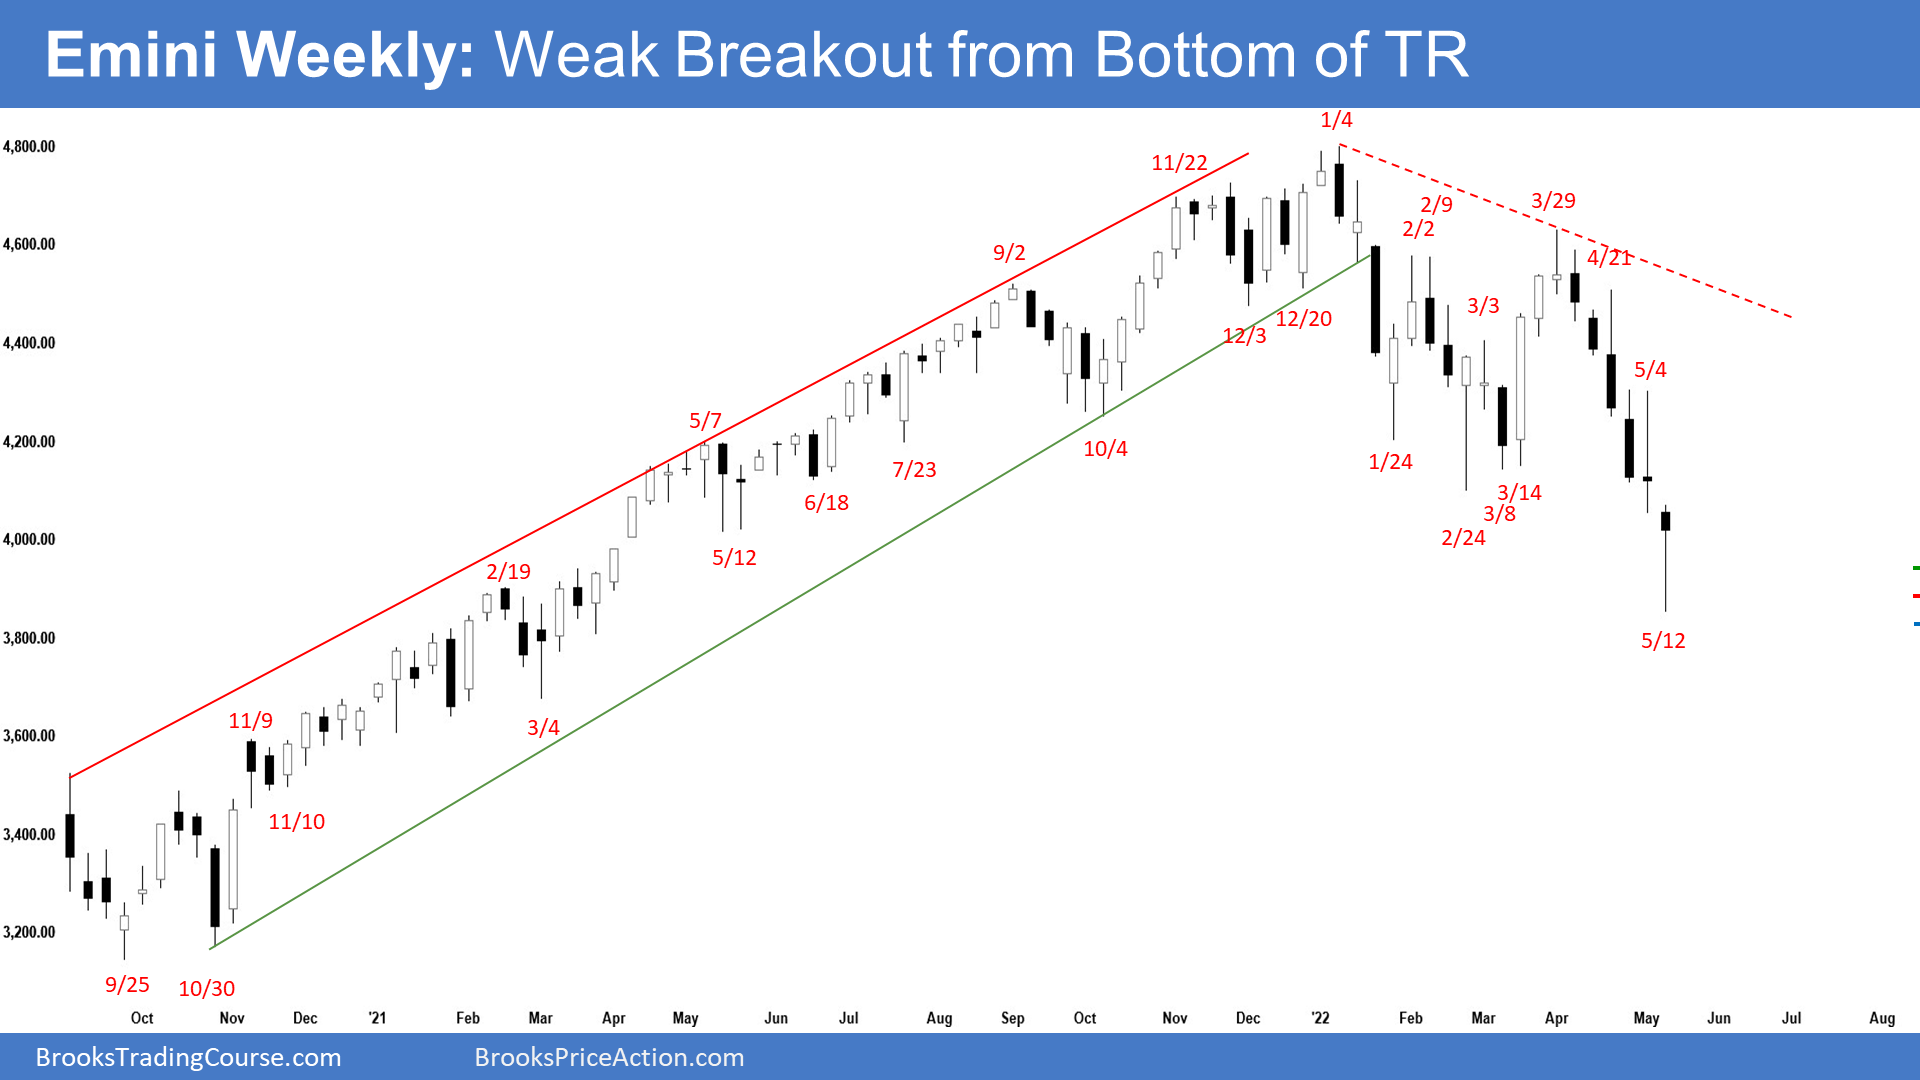
- This week’s E-mini candlestick was a bear bar with a long tail below closing below February low. It closed at the upper range of the bar and was a weak breakout bar.
- Last week, we said that the E-mini may need to trade sideways to up for another week or two before traders are willing to bet aggressively on a breakout below or a reversal higher.
- Odds favor at least a small second leg sideways to down move after a pullback (bounce) and because the bears got consecutive big bear bars closing near the low, it increases the chance of a downside breakout attempt.
- This week broke below the 9-month trading range. While the candlestick had a bear body, the long tail below indicates that the bears are not as strong as they could have been.
- Bears want a strong break below the February 24 low which is the neckline of the double top bear flag and a measured move down towards 3600 based on the height of the 9-month trading range.
- The bears will need to close next week as another bear bar to confirm the breakout.
- The bulls want a failed breakout below the 9-month trading range.
- They see a wedge bull flag (Jan 24, Feb 24, and May 12) with an embedded parabolic wedge (April 26, May 2, and May 12) and want a reversal higher from a lower low major trend reversal.
- They want a reversal back to the middle of the 9-month trading range around 4400.
- The selloff from March 29 has been very strong. The bulls will need at least a micro double bottom or a strong reversal bar before they would be willing to buy aggressively.
- This week closed at the upper range of the bar with a long tail below, it is a moderate reversal bar. It would have been a stronger reversal bar if it had a bull body closing near the high. It is a buy signal bar for next week.
- The bulls will need to close next week as a follow-through bull bar. If they get that, a 2 legged sideways to up minor pullback should begin.
- Al has said that the E-mini has been oscillating around 4,400 for 9-months. That price might well end up being the middle of the trading range. Since the top of the range is about 400 points higher, the bottom could be 400 points lower. That is below the February low and around the 4,000 Big Round Number.
- If it gets there, traders will then wonder if the E-mini might fall for a measured move down from the February/March double top. That would fill the gap above the March 2021 high on the monthly chart.
- There are 6 consecutive bear bars in the current leg down, something that has not happened since June 2008. It increases the odds that we will get a bull bar within the next 1 to 2 weeks.
- The E-mini may need to trade sideways for another week or two before traders are willing to bet aggressively on a breakout below or a reversal higher.
- Because of the weak breakout this week, odds slightly favor sideways to up pullback to begin anytime soon.
- However, because of the tight bear channel down, odds are the pullback would be minor and traders expect at least a small second leg sideways to down move after a pullback because V-bottoms are not common.
3rd party Ad. Not an offer or recommendation by Investing.com. See disclosure here or
remove ads
.
The Daily S&P 500 E-mini chart
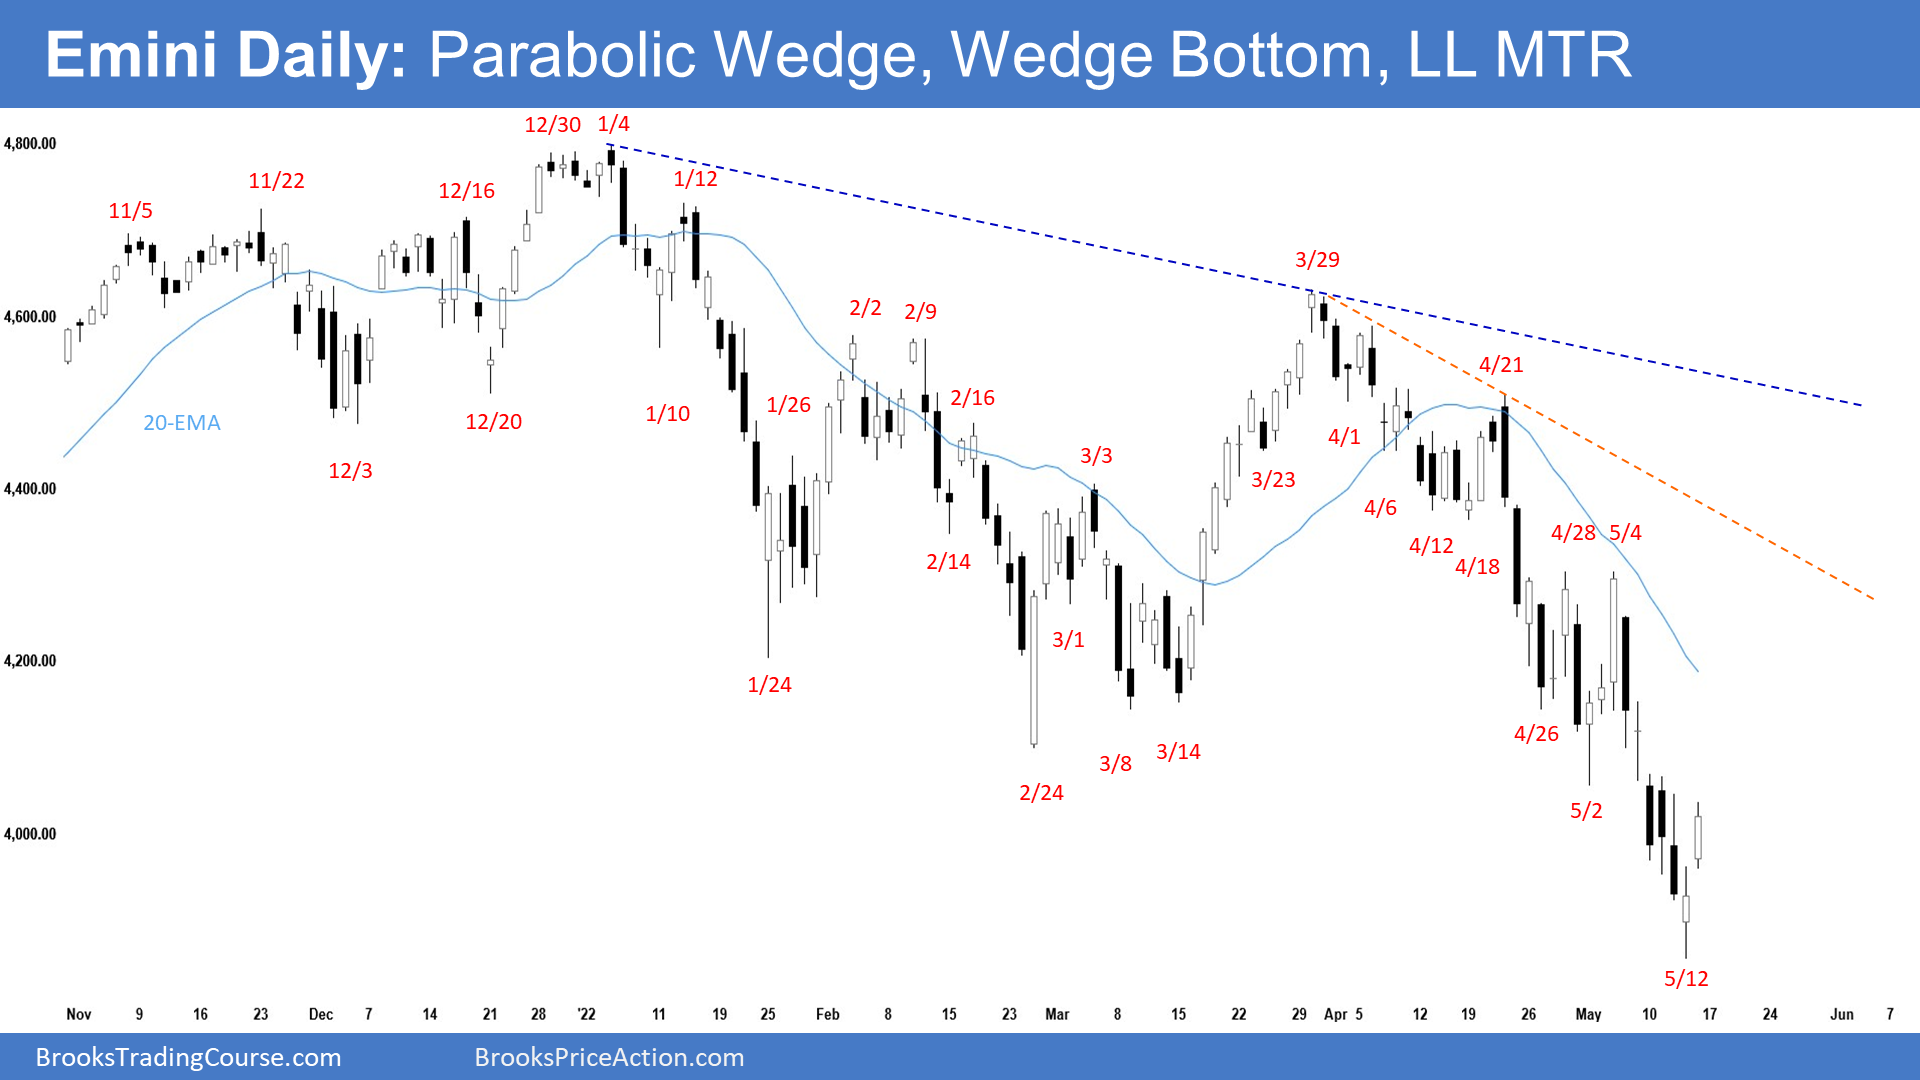
- The E-mini gap down and broke below February low on Monday. The bears got follow-through selling on Tuesday and Wednesday.
- Thursday gap down and traded below 3900 but reversed up from a parabolic wedge (Feb 26, May 2, and May 12) closing with a bull body. Friday gapped up and closed as a big bull bar the high with a small tail above.
- Last week, we said that the prior Friday’s candlestick was a weak buy signal bar. The bulls will trigger the high 2 buy signal by trading above it. However, the buy signal bar was not triggered.
- This week, the E-mini traded below the February low. While the bears got consecutive bear bars through midweek, the candlesticks were overlapping. That indicates the bears are not as strong as they could have been.
- The bulls want a reversal higher from a wedge bull flag (Jan 24, Feb 24, and May 12) with an embedded parabolic wedge (April 26, May 2, and May 12) and a lower low major trend reversal.
- They want the breakout below the 9-month trading range to fail and a reversal back into the middle of the trading range around 4400.
- The bears want a strong break below February 24 low and a measured move down to around 3600 based on the height of the 9-month trading range.
- The channel down from March 29 to May 12 has been tight. That means strong bears. Traders expect at least a small second leg sideways to down after a pullback (bounce).
- Bears want this bounce to be a test of the breakout point, which is the February low. If the bulls fail to reach the breakout point, it could potentially be a measuring gap.
- Al has said that the E-mini has been oscillating around 4,400 for 9 months. That price might well end up being the middle of the trading range. Since the top of the range is about 400 points higher, the bottom could be 400 points lower. That is below the February low and around the 4,000 Big Round Number.
- If it gets there, traders will then wonder if the E-mini might fall for a measured move down from the February/March double top. That would fill the gap above the March 2021 high on the monthly chart.
- If there is a pullback (bounce) it may reach back to the 20-day exponential moving average.
- Since Friday was a bull bar with a small tail above, it is a moderate buy signal bar for Monday. The bulls will need to follow through buying early next week to convince traders that a 2 legged sideways to up pullback is beginning.
- The move down since March 29 was in a tight bear channel, so odds are the pullback would be minor.
- The sell-off since March 29 was strong enough for traders to expect at least a small second leg sideways to down after a pullback (bounce).
3rd party Ad. Not an offer or recommendation by Investing.com. See disclosure here or
remove ads
.