It's been a rocky month so far for the U.S. stock market. After hitting an all-time high above 3,000 in late July, the S&P 500 Index (SPX) plummeted to a two-month low in early August, amid concerns about the U.S.-China trade war, future Fed policy, and a global recession. Against this backdrop, several sentiment indicators are lighting up -- and here's what that could mean for stocks, if past is prologue.
CNNMoney Fear & Greed Index Falls
The CNNMoney Fear & Greed Index is comprised of seven separate indicators, including the number of stocks hitting new highs vs. new lows on the New York Stock Exchange (NYSE), demand for junk bonds, and the difference in returns between U.S. stocks and Treasuries. After a reading of 64 one month ago -- under the "Greed" umbrella -- the index has tanked to 27, on the cusp of "Extreme Fear."
Recession Fears Among Fund Managers Spike
Per the BofA-Merrill Lynch survey of fund managers, one-third of investors expect a global recession in the next year -- an eight-year high. What's more, the survey indicated that a record number of those polled have taken some sort of precaution against a sharp fall in stocks, and the "biggest tail risk" for the fifth straight month was the trade war. Meanwhile, more evidence that traders are seeking safety in bonds: U.S. Treasuries were the most crowded long trade for a third consecutive month.
Economists On Edge
Over the weekend, economists at Goldman Sachs (NYSE:GS) said they no longer expect a U.S.-China trade resolution before the 2020 presidential election. "Fears that the trade war will trigger a recession are growing," wrote Goldman Sachs chief economist Jan Hatzius. The firm also cut its fourth-quarter U.S. growth forecast, and said uncertainty around the trade war "may lead firms to invest, hire, or produce less."
In the same vein, Bank of America (NYSE:BAC) now pegs the chance of a recession in the next year at greater than 30%. Chief economist Michelle Meyer cited the "policy ping pong," as well as several economic indicators, including the inverted yield curve.
Morgan Stanley (NYSE:MS), meanwhile, said a recession could hit within nine months, if President Donald Trump slaps 25% tariffs on another $300 billion in Chinese goods. The White House is set to impose just 10% tariffs on various goods on Sept. 1, but today announced plans to delay tariffs on some items until December.
NAAIM Survey Sees Biggest Weekly Drop in Six Years
The National Association of Active Investment Managers (NAAIM) survey saw the largest weekly and two-week point decline since August 2013, dropping 34.8 and 39.2 points, respectively, to 56.59 last week. On a percentage basis, the NAAIM survey plummeted 38% and 41%, respectively -- the steepest drops since the December 2018 sell-off. Last quarter, the NAAIM survey -- which represents active money managers' equity exposure -- average was 77.30.
AAII Bears Double in a Week
Finally, the American Association of Individual Investors (AAII) weekly sentiment survey recorded the largest drop in bullish respondents of 2019, and the fourth-biggest drop since the March 2009 bottom, per Schaeffer's Research Department. Specifically, AAII bulls fell 16.8 percentage points to 21.7% of those polled. AAII respondents identifying as bearish or neutral toward stocks rose to 78.3% last week, the most since mid-December.
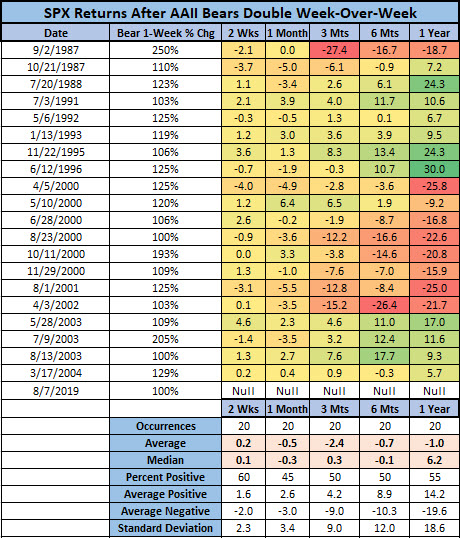
What's more, the number of AAII bears doubled week-over-week, to 48.2% of respondents. Since the March 2009 bottom, there's been just one other time when bears came close to doubling, back in April 2013. The last time AAII bears more than doubled was March 2004.
Since 1987, and looking at only one signal per month, there have been 20 other times when the number of AAII bears doubled in one week. After those instances, the S&P 500 underperformed at every checkpoint, averaging a three-month loss of 2.4%. That's compared to an average three-month gain of 2.1%, looking at SPX anytime data since 1987. One year after a signal, the S&P was down 1% on average, compared to an average anytime one-year gain of 8.7%.

However, keep in mind that most of those post-signal losses occurred in the early aughts, right around the dot-com bubble burst. Since 2003, the SPX was higher three months and one year later each time.
In conclusion, macro events will likely continue to determine the trajectory of stocks, at least in the short term. Of note, developments in the U.S.-China trade/currency spat, or the next round of jobs or inflation data with Fed implications, could cause a stock market reaction. Not to mention Wall Street is keeping an eye on growing protests in Hong Kong.
Should the next round of headlines boost equities, contrarians can find comfort in the old adage that "markets advance on a wall of worry and decline on a slope of hope." In the meantime, speculators should consider using options to play short-term volatility. Per Schaeffer's Senior V.P. of Research Todd Salamone, "The environment continues to make options an attractive vehicle relative to stocks, as you are able to put less money in the market to deal with the enormous uncertainty, but the leverage allows you to realize meaningful profits."
