For the Week of July 15
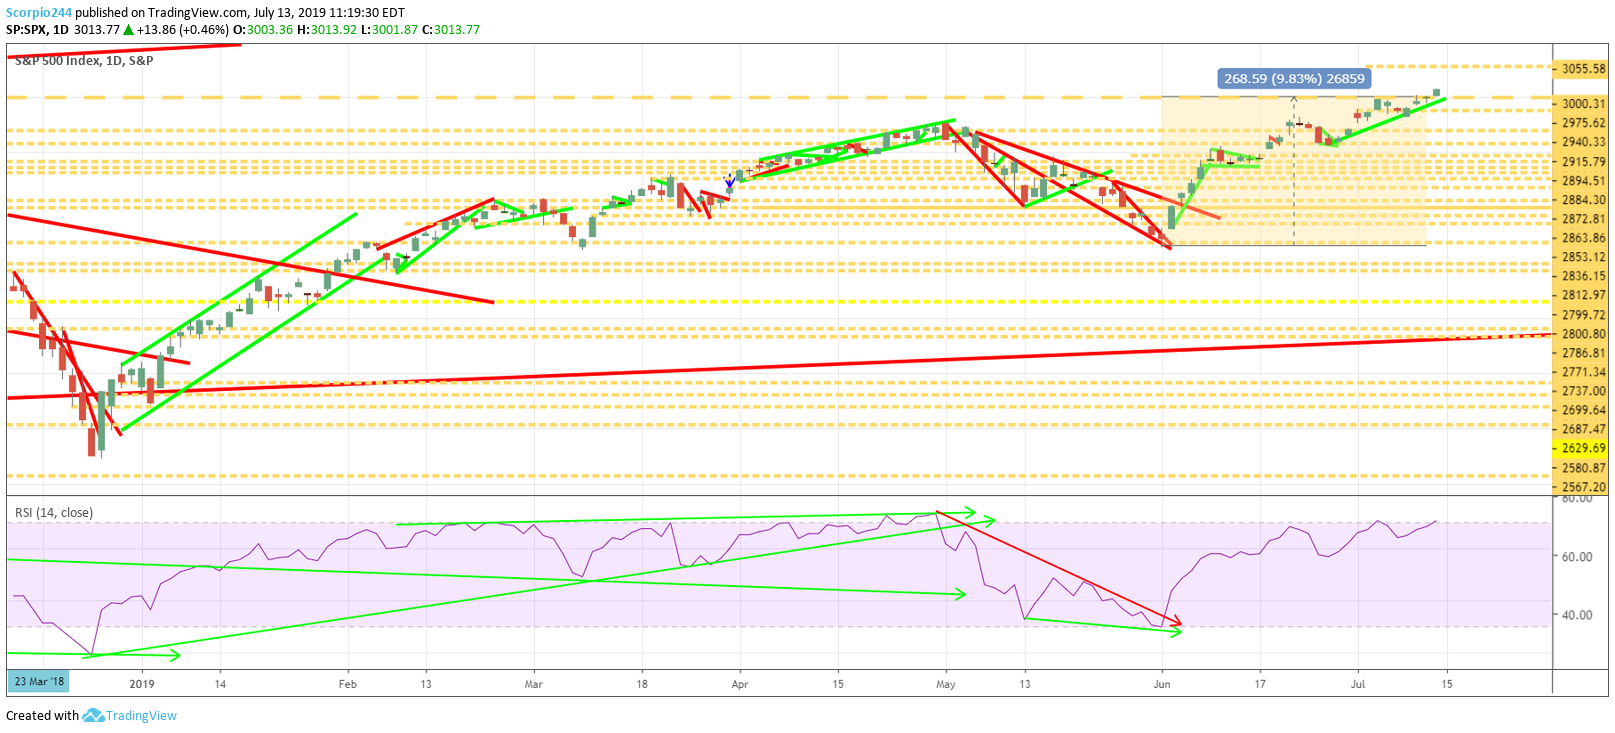
Stocks managed to put on a strong showing on July 12, with the S&P 500 rising by almost 50 bps to close at 3,013. The run to 3,050 appears to now be in place. Hopefully, the index makes it to 3,050. It is imperative to me that the index makes it to 3050, more than you may realize. The prior market peak was at 2,954 at the beginning of May, and currently, we are just 2% above that peak. While it may sound stupid or trivial, the one thing we don’t want to develop is this conversation that the S&P 500 can’t get over 3,000. While 3,013 is over 3,000, it isn’t far enough above 3,000 to make the bears or any nay-sayers argue that 3,000 is a peak or a top. At 3,050 it puts the S&P 500 more than 3% above the prior highs, and it would be at that point there wouldn’t be a shadow of a doubt that the market has surpassed 3,000. Maybe it is merely optical, but having been in this business for nearly 25 years, I know how it works, and I know the conversations and the narratives that develop. I don’t want there to be any conversation or any doubt about the health of the market, or these story about a rolling bear market. The only way I see that happen is by reaching 3,050.
S&P 500 (SPY)
We can see the S&P 500 broke out on Friday clearing resistance at 3,000, and that sets up an increase to 3,055.
Earnings
It won’t be easy, especially with the week of July 15 being the first big week of earnings, with some massive companies reporting results. The big banks will report result Monday and Tuesday morning with Citigroup (NYSE:C), JPMorgan (NYSE:JPM), and Bank of America (NYSE:BAC) all going first. Netflix (NASDAQ:NFLX) and Microsoft (NASDAQ:MSFT) will follow on Wednesday and Thursday. We will find out very soon if earnings estimates for the S&P 500 are too high or too low.
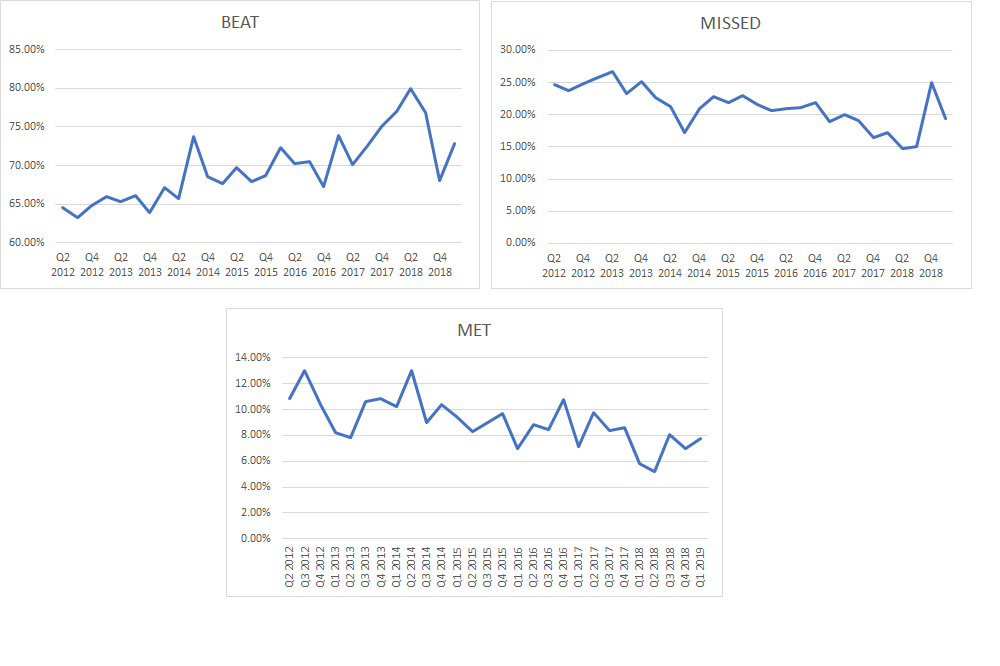
Last quarter turned out to be better than expected with 73% of companies topping results, 19% missing results, and 8% meeting estimates. Since the second quarter of 2012 on average, 69.7% of companies have beaten estimates each quarter, with a standard deviation of 4.25%, while 21.3% have missed forecasts with a standard deviation of 3%, and 9% have met with a standard deviation of 2%. If we get a similar 73% again in the second quarter, it would suggest a better than average quarter, at the upper end of the historical range.
Banks
You have to wonder how these banks will do this quarter, especially with interest rates plunging, potentially hurting net interest income. However, it seems that in recent quarters, the banks have managed to surprise investors in that department. Also, it was a robust IPO calendar, so perhaps better Investment Banking fees and Loan Growth can offset any surprises in interest income.
Citigroup (C)
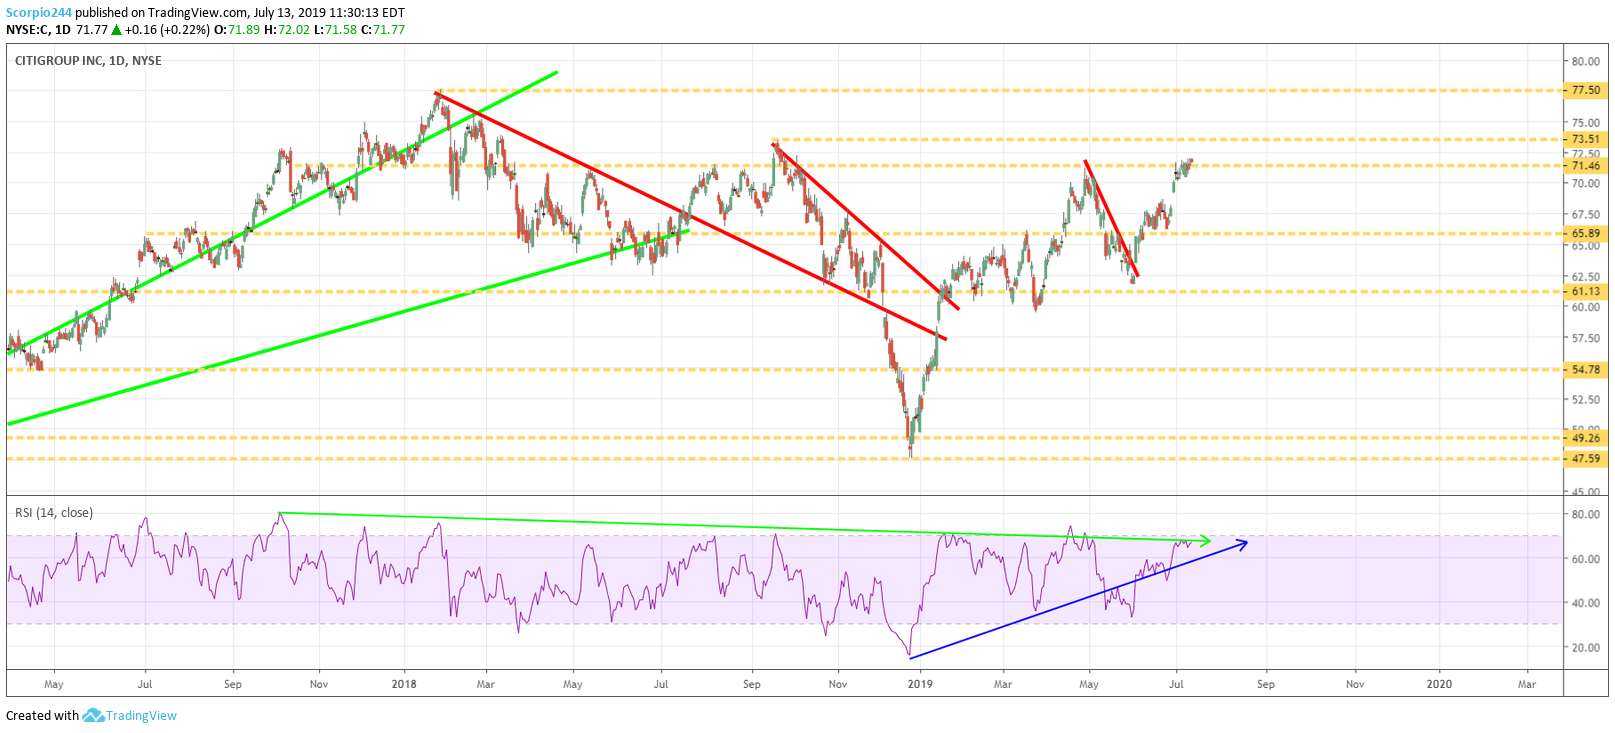
Citigroup will report results on Monday morning, and analysts are looking for earnings of $1.80 per share on revenue of $18.49 billion. The company has a strong history of topping results, with earnings beating estimates five quarters in a row. Revenue has been mixed and is typical around estimates.
It’s tough to look at a chart of Citigroup and get a sense of what the market is thinking about because the chart doesn’t look particularly strong. Perhaps that is an indication that the results won’t be strong enough to push shares higher. The upside to the stock looks limited at $73.50; downside risk is higher with a drop to $66 more likely.
JPMorgan (JPM)
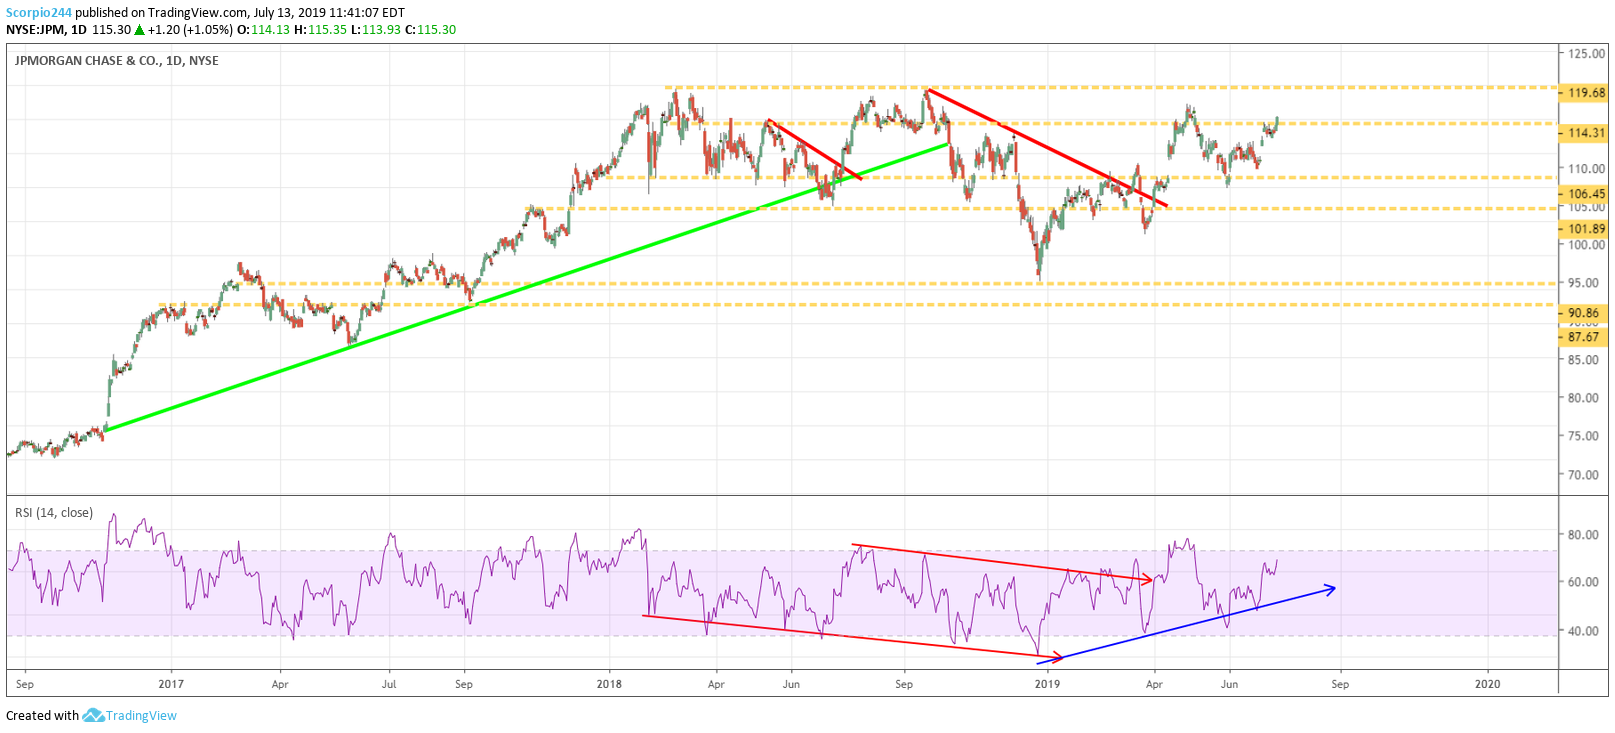
JPMorgan is expected to report earnings of $2.49 per share, on revenue of $28.52 billion. Surprisingly, JPM topped earnings just three times in the last five quarters. Meanwhile, revenue results have been just as inconsistent.
The technical chart looks better for JPM than Citigroup, with an RSI that still has further room to rise. Meanwhile, JPM has recently been increased above a resistance level at $114.30 and could push to its all-time high near $120.
Bank of America (BAC)
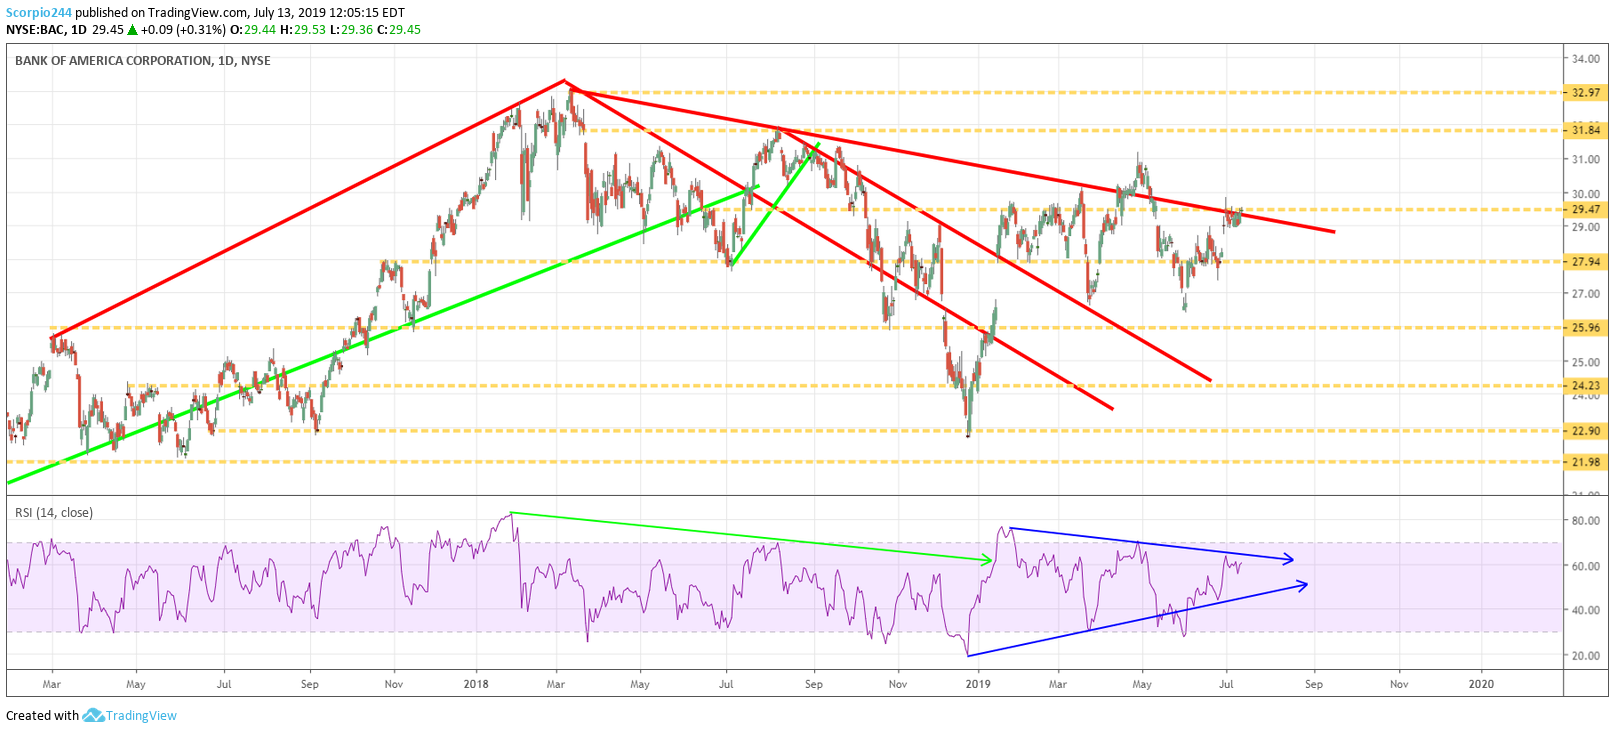
Meanwhile, Bank of America is expected to report revenue of $23.13 billion and earnings of $0.71. The company has reported earnings that topped estimates for eight quarters in a row. Meanwhile, like the other bank’s, revenue results have been mixed.
The stock has been rising and appears to be testing a break out at resistance at $29.50. It could be setting up for an increase to around $32 in the coming weeks.
Netflix (NFLX)
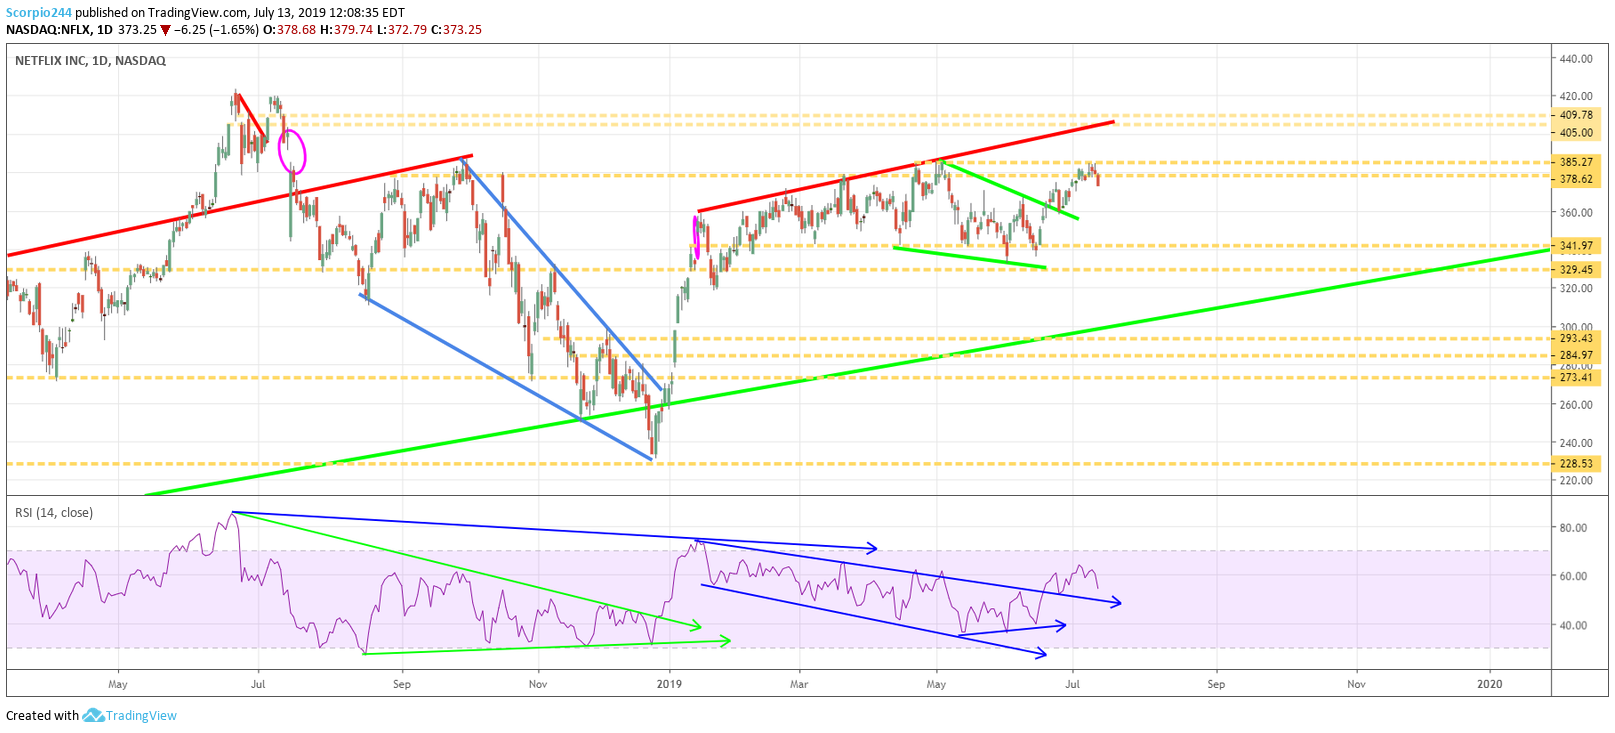
NFLX is expected to report results, and lately, the total number of subscribers has seemingly mattered less and less, as investors have started to focus more on things like revenue, earnings, and cash flow. But still, subscriber additions will weigh large. NFLX has mostly been consolidating sideways since the beginning of 2019. The next significant level I continue to look for is $405, and the RSI continues to suggest that NFLX trends to that price.
Microsoft (MSFT)
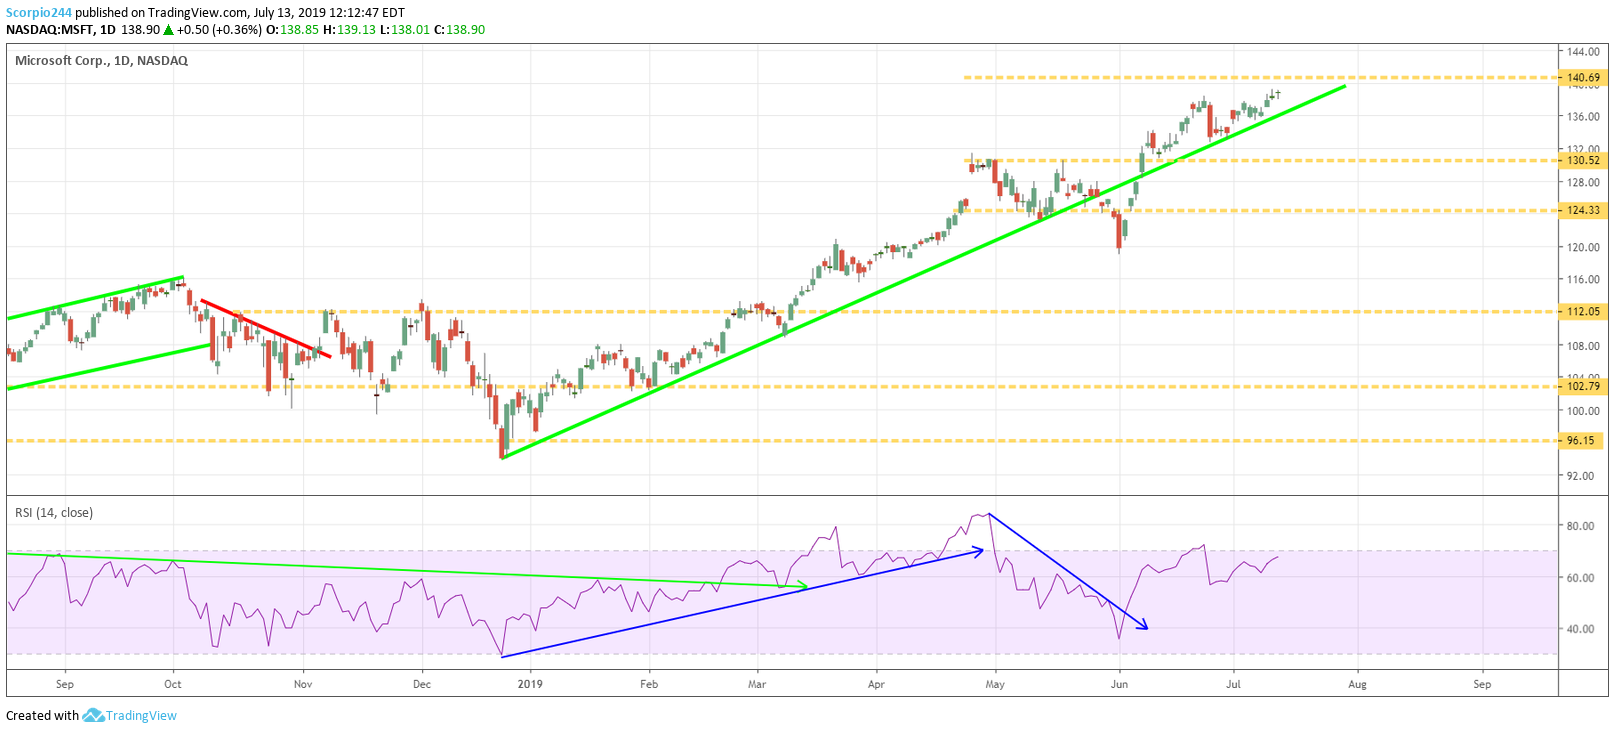
Microsoft is expected to report fiscal fourth-quarter earnings of $1.21 per share on revenue of $32.8 billion. MSFT seems reasonably valued at just 23 times 2020 earnings estimates of $5.10 per share. However, MSFT has had an incredible run, and it is approaching my target of $141. While I expect MSFT to continue to have a strong run in the future, shares may fall to around $130 in the days following results.

