Here are five big-league reasons to evaluate your current asset mix:
1. Credit Fundamentals Are Deteriorating
What do you remember about the financial crisis in 2008? Perhaps you think about a term like “subprime mortgage.” Or maybe you recall the way home values and stock prices collapsed. Either way, most would agree that households and businesses with too much access to credit borrowed beyond their means.
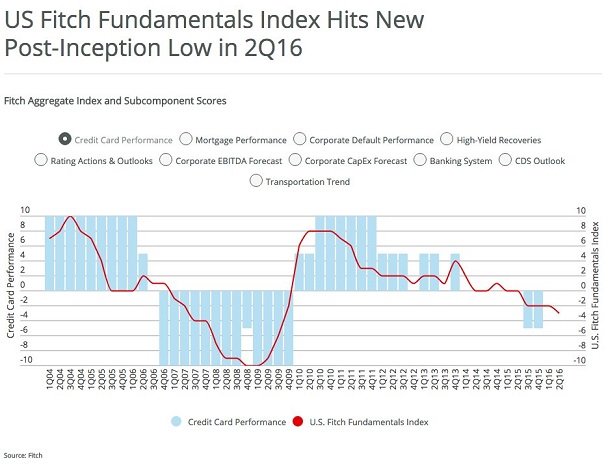
Is it happening again in 2016? The Fitch Fundamentals Index (FFI) tracks changes in credit fundamentals across ten key areas of the U.S. economy. The FFI recently notched its lowest level since the 3rd quarter of 2009.
In truth, the current reading is less troublesome than the trend over time. Many of the subcomponents for the index are getting worse every quarter. Corporate defaults? Awful. Credit default swaps? Perilous. Meanwhile, global growth concerns have been pressuring company forecasts for how much they might spend on land, buildings as well as equipment in the foreseeable future.
2. Margin Debt Is Sinking
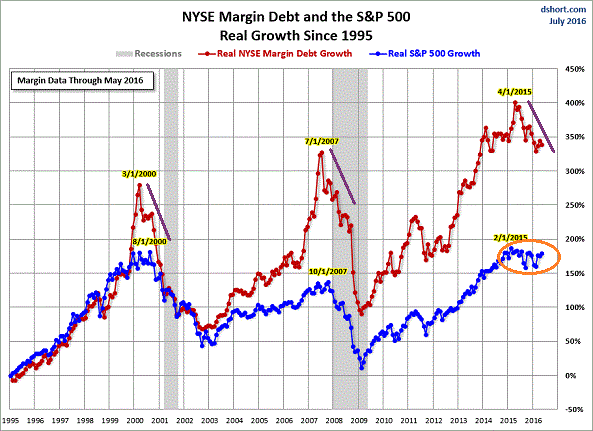
The New York Stock Exchange recently acknowledged that margin debt declined for the second consecutive month in June. It is now sitting near the levels of the recent January-February stock swoon.
Again, the individual data point may be far less relevant than the longer-term trend. Historically speaking, investors borrow money to leverage their success with stocks. The activity helps propel U.S. benchmarks to new highs. When margin debt peaks and then begins reversing itself, though, severe stock declines have followed.
Margin debt reversal accompanied stock price disintegration in 2000’s “New Economy.” The turnaround for buying stocks in margin accounts escorted price destruction in the 10/07-3/09 bear. So far, real S&P 500 growth has managed to hold up since margin debt peaked a little more than a year ago. Nevertheless, benchmark progress has been insubstantial since margin debt peaked.
3. Valuations Are Divorcing From Rationality
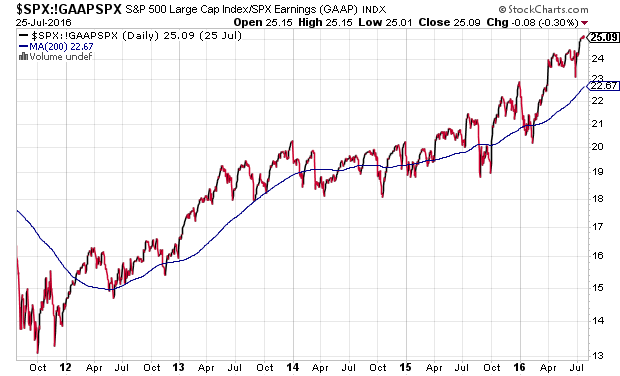
According to Goldman Sachs, the S&P 500’s forward price-to-earnings (P/E) ratio has surged 75% in just under five years. Specifically, since September of 2011, Forward P/Es have moved from 10 to 18.
What may be particularly telling here is that the expansion cycle for prices relative to profits is the third largest over the last 40 years. The others? Forward P/Es rocketed 111% from 1984-1987 before the infamous Black Monday crash. They soared 115% from 1994-1999 prior to the bursting of the dot-com bubble.
In actuality, the median constituent of the S&P 500 has a Forward P/E of 18.4 – a multiple that rests in the 99th percentile of historical valuation levels. What’s more, data at the S&P/Dow Jones web site anticipates June 2017 GAAP earnings of $115.58. At 2167 on the S&P 500, the Forward P/E is an astronomical 18.75 and the Current P/E on present earnings estimates of $88.53 is a ludicrous 24.5. (Note: Collective earnings for the S&P 500 rang in at nearly identical levels on 3/31/2012 at $88.54.
4. Demand For Perceived Safer Havens Is Still Beating Riskier Stocks
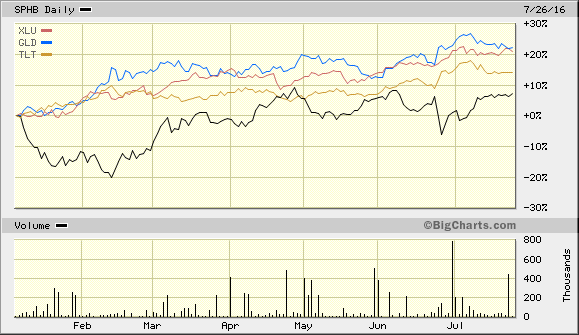
One might surmise that if the new all-time records for the Dow Jones Industrials and S&P 500 actually had teeth, demand for perceived safety would wane. On the contrary. In spite of the reality that precious metals do not offer a dividend or interest payment, investors still seem to want gold via the SPDR Gold Trust ETF (NYSE:GLD). Regardless of the price volatility on low-yielding 20-plus year Treasuries, the collective investment community still covets exchange-traded trackers like iShares 20+ Year Treasury Bond (NYSE:TLT).
There’s more. Since the start of the year, investors have been clamoring for more and more exposure to utility stocks via funds like SPDR Select Utilities (NYSE:XLU). “Riskier” high beta sectors like energy, financials and technology in PowerShares S&P 500 High Beta Portfolio (NYSE:SPHB)? Not as much.
Granted, every asset class on the planet may have seen a significant bounce off of the February stock lows. And we can all thank the world’s central banks (e.g., Federal Reserve, Bank of Japan, Bank of England, European Central Bank, etc.) for creating the monetary credits that find their way into market-based securities. On the flip side, when “risk-off defensive areas” are matching or surpassing the performance of “risk-on” cyclical segments, it is rarely a bullish sign for the latter.
5. Global Recessionary Pressures Are Not Fading
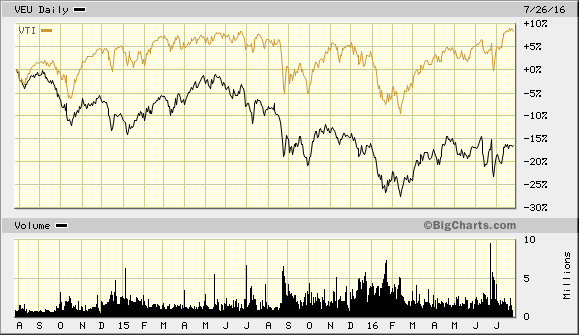
Over the last two years, ;the Vanguard Total Stock Market Fund (NYSE:VTI) has gained roughly 8%. Vanguard All-World excluding the U.S. (NYSE:VEU)? The exchange-traded fund registered -16%.
It is true that the European Central Bank (ECB) and the Bank of Japan (BOJ) stepped up to the plate with more “stimulus” at the start of 2016. On the other hand, the U.S. Federal Reserve backed off its pledge to raise rates four times in 2016. Yet is it really the case that the long-term downtrend in overseas equities has been stopped in its tracks? Probably not. Is the U.S. going to remain an island that only needs to rely on its “service economy?” I doubt it.
Often overlooked in the debate between the importance of services relative to manufacturing is the reality that manufacturing still accounts for as much as half of the S&P 500’s profits. So when manufacturing dynamos like Caterpillar (NYSE:CAT) experience 43 consecutive months of year-over-year declines in sales, or when quarterly sales for S&P 500 constituents fall for six consecutive quarters, you ought to wonder if central bank accommodation (i.e., manipulation) can keep the U.S. stock train moving forward indefinitely.
Disclosure: Gary Gordon, MS, CFP is the president of Pacific Park Financial, Inc., a Registered Investment Adviser with the SEC. Gary Gordon, Pacific Park Financial, Inc, and/or its clients June hold positions in the ETFs, mutual funds, and/or any investment asset mentioned above. The commentary does not constitute individualized investment advice. The opinions offered herein are not personalized recommendations to buy, sell or hold securities. At times, issuers of exchange-traded products compensate Pacific Park Financial, Inc. or its subsidiaries for advertising at the ETF Expert web site. ETF Expert content is created independently of any advertising relationships.
