The race to declare dominance over a particular segment of the market is one that fund companies dream about. They work hard to conjugate unique strategies that stand above plain vanilla indexes in the hopes that their secret sauce adds a measure of value. While this year found many fundamental or “smart beta” ETFs at parity with their passive benchmarks, there were some select ETFs that were worth the added layer of sophistication.
Minimum volatility ETFs have become a mainstream alternative for core equity allocations among conservative ETF investors. The PowerShares S&P 500 Low Volatility Portfolio (NYSE:SPLV) and iShares MSCI U.S. Minimum Volatility ETF (NYSE:USMV) are both designed to select a subset of stocks with lower overall price fluctuations than their index peers. This leads to a smaller basket of stocks with reduced risk characteristics than a traditional broad-based fund.
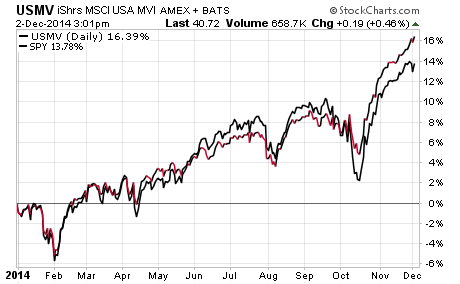
This year, both SPLV and USMV have modestly outperformed the market-cap weighted SPDR S&P 500 ETF (ARCA:SPY) by 2.5% on a total return basis. This is due in large part to overweight allocations in utilities, consumer staples, and health care sectors, which have been persistent market leaders in 2014. In addition, the comparative chart below shows how USMV had much lower overall drawdown in the October sell-off than SPY. This ETF proved to effectively reduce drawdown as its investment mandate implies.

Another smart beta ETF showing a burst of relative strength is the First Trust Capital Strength ETF (NASDAQ:FTCS). This fundamental index is constructed of 50 stocks with high cash reserves, low debt, and sturdy return on equity. Companies are selected and then ranked within the ETF by the lowest volatility with caps on individual sector and industry weightings. The end result is a value-oriented group of high quality stocks, spread across multiple areas of the domestic market with an equal weighted asset allocation.
FTCS has gained 15% in total return this year versus 12% in the benchmark iShares S&P 500 Value ETF (ARCA:IVE). The biggest contributor to this performance divergence is due to the minimal exposure of energy stocks in FTCS, which have dragged down the broader IVE in recent months.
Moving down the field to small cap stocks, the WisdomTree SmallCap Dividend Fund (NYSE:DES) has been a standout performer in a relatively weak segment. This ETF focuses on a tight grouping of 673 small capitalization companies with above-average yields. The holdings are weighted according to a proportionate share of aggregate cash dividends the stocks are projected to pay. This coalesces to generate a 30-day SEC yield of 2.78% and income is paid monthly to shareholders.
So far this year, DES has gained 5.44% versus 1.70% in the iShares Russell 2000 ETF (ARCA:IWM). In addition, this ETF has shown lower overall volatility and is currently trading near its 2014 highs.
While outperformance will come and go in the ETF world according to market cycles, these funds have shown to be consistent alternatives with established track records. They each offer a unique value proposition with attractive fundamental for investors seeking enhanced strategies for their portfolios.
