A vital lesson to learn from Bitcoin’s short, but violent history
Bitcoin (BTC) crashed. Again. Yesterday, the cryptocurrency fell from as high as $1075 to below $914, bringing back the memories from the disastrous selloff we saw in the first days of 2017. It looks like each time Bitcoin rises significantly, a violent reversal follows. Obviously, the digital currency is prone to crashing. Since it happens so often, we should be able to find a pattern, right? We need a pattern, explaining that mania-panic phenomenon. The Elliott Wave Principle has a suggestion.
According to the theory, the direction of the trend can be identified by recognizing a five-wave impulse. The third wave of the impulsive pattern is usually the longest. However, sometimes, usually when we talk about a commodity, whose supply is theoretically limited, the fifth wave might extend. It happens because people’s greed during this last phase of the pattern makes them believe the world is going to run out of the thing in question, which in turn leads to a completely irrational price surge.
Bitcoin’s supply is limited not only in theory, but in reality as well. The maximum amount of bitcoins that could be mined is 21 million and roughly 70% of that has already been produced. This makes bitcoin the perfect field for a mania, or an extended fifth wave, to occur. The problem is that the fifth wave, extended or not, is just a phase of the larger impulse and we know that every impulse is followed by a correction in the opposite direction. So once the mania is taken to the maximum extreme, where it can no longer continue, the exact opposite emotion takes over people’s minds. The emotion is fear and its extreme condition is panic. In other words, what we really need to look for is an extended fifth wave followed by a decline of similar magnitude. On bitcoin’s charts that is not very hard to find.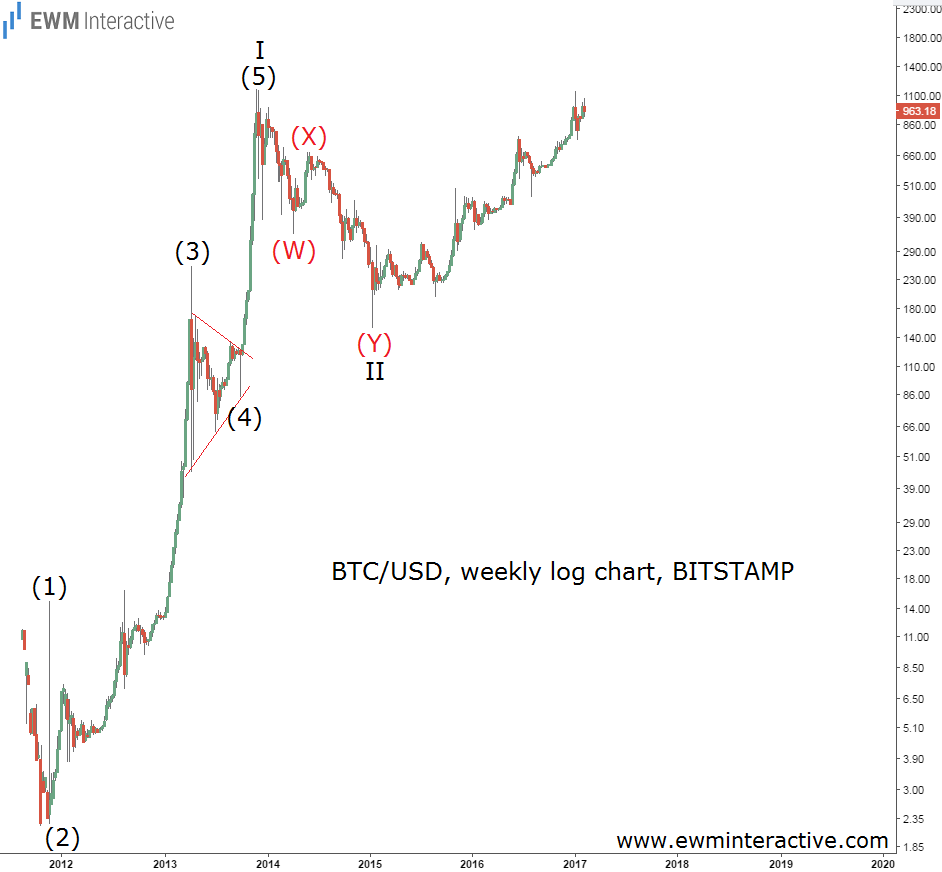
This is bitcoin’s weekly logarithmic chart. It shows that between October 2011 and November 2013, bitcoin traveled all the way up from $2.22 to $1163. Furthermore, this impressive advance developed in impulsive fashion. What we are interested in is its fifth wave – from $85 to $1163. As you can see, once it was over, the bears took the wheel and erased almost all of wave (5)’s gains to drag the price of bitcoin to as low as $152.40 by January 2015. On the chart above, wave (5) does not seems to be longer than wave (3), because logarithmic charts remove the effect of inflation. In reality, on a normal price chart, wave (5) and the following wave II crash look like this.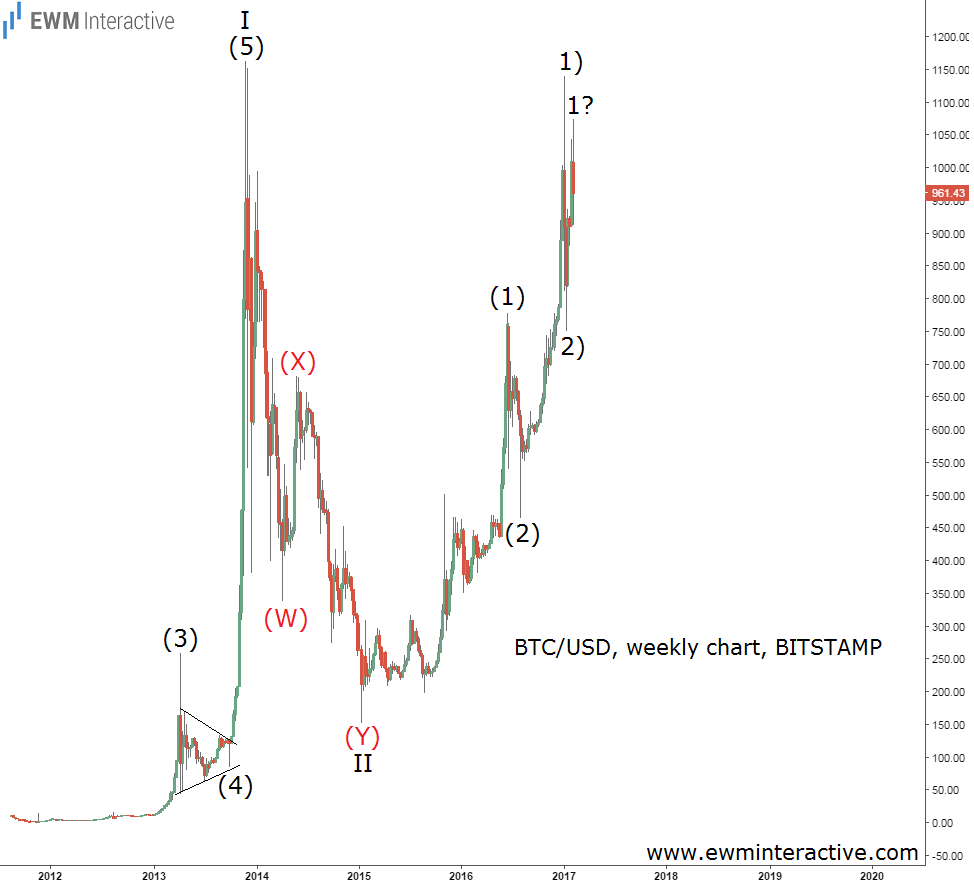
Nobody would argue that in 2013, over-optimism led to the first bitcoin bubble. Just like any other bubble in history, things did not end up well. Wave II erased almost the entire progress achieved by wave (5). However, bitcoin survived and in June 2016, was hovering around $780 again. On the chart above, this top is marked as the end of wave (1). Let’s see its wave structure and see if we could find something familiar.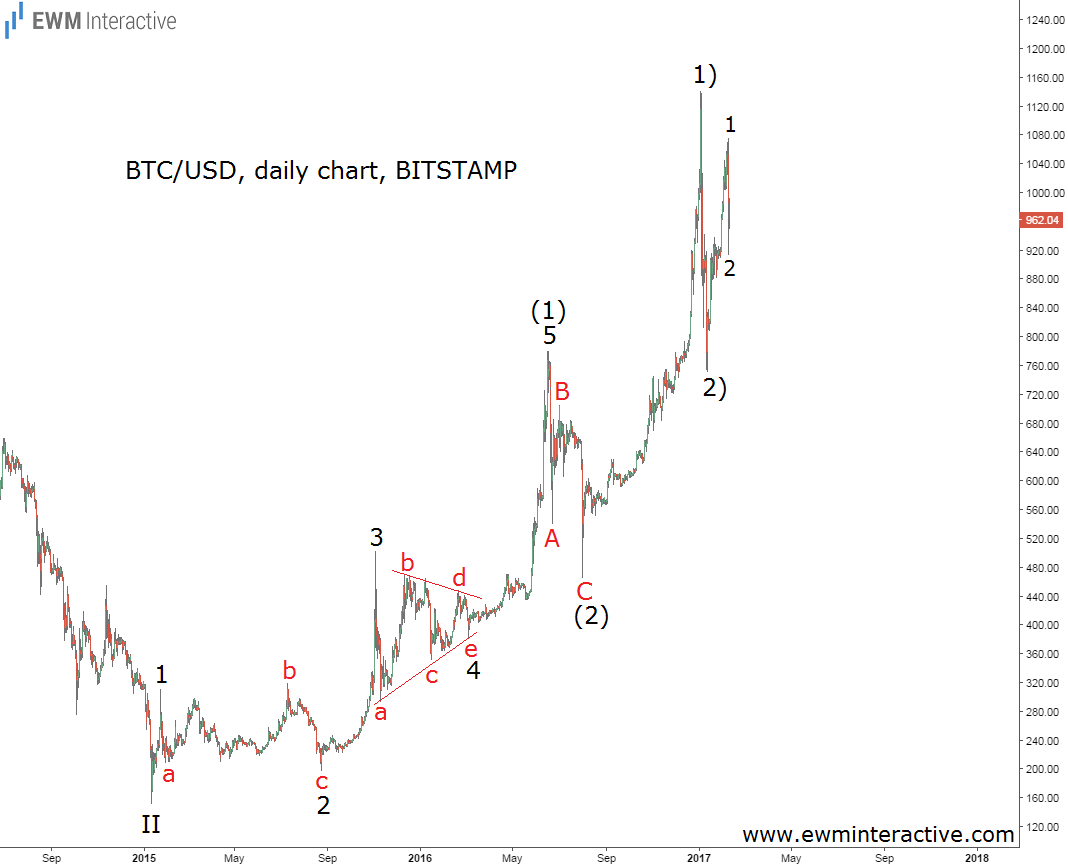
The daily chart allows us to see the entire uptrend from $152.40. As visible, wave (1) is a clear five-wave impulse. Wave 2 is an expanding flat correction, while wave 4 of (1) is a triangle. This leads us to wave 5 of (1), which is, once again, extended! It traveled roughly the same distance as waves 1 and 3 combined. Unfortunately, just like the previous extended fifth wave in 2013, this one led to the same consequences – a sharp correction in wave (2), retracing nearly everything wave 5 of (1) was able to achieve.
According to mainstream media, the slump to $465 in wave C of (2) was caused by news about a massive theft of $72 million worth of bitcoin from the Bitfinex exchange in Hong Kong on August 2nd, 2016. On the other hand, Elliott Wave analysts saw it as nothing more than a natural correction, preceding the next phase of the trend, labeled as wave 1). Wave 1) lifted bitcoin’s price from $465 up to $1140 by early January, 2017. Unfortunately, history rhymed itself again.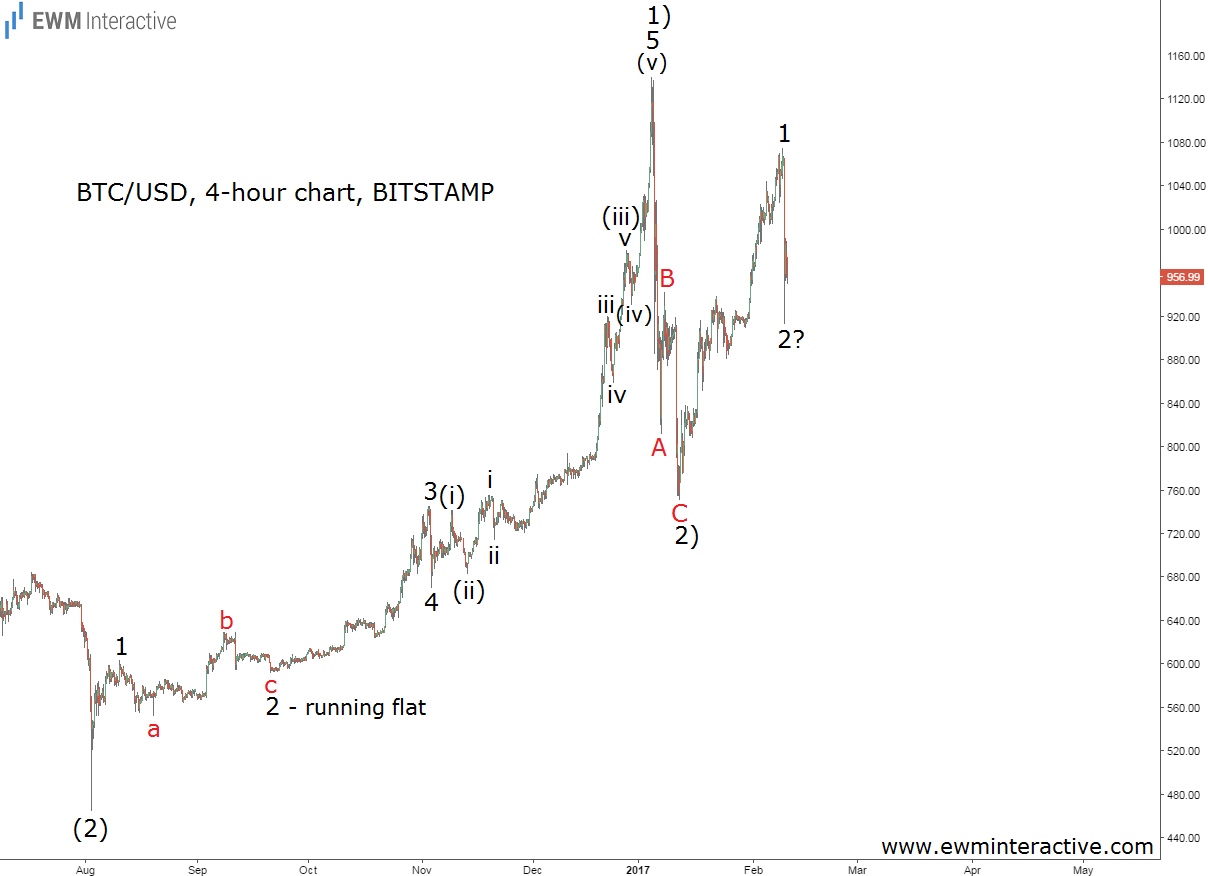
The surge in wave 1) could be seen as an impulse, as well. On top of that, wave 5 of 1) is – you guessed it – extended! It is 1.618 times longer than waves 1 and 3 combined, and just like the previous two extended fifth waves we examined, was followed by a massive crash in wave 2) all the way down to $751, where bitcoin finally found a strong enough support to bounce up from. This brings our total extended fifth wave count to 3. But the title of this article says “4 lessons” so here is the fourth one.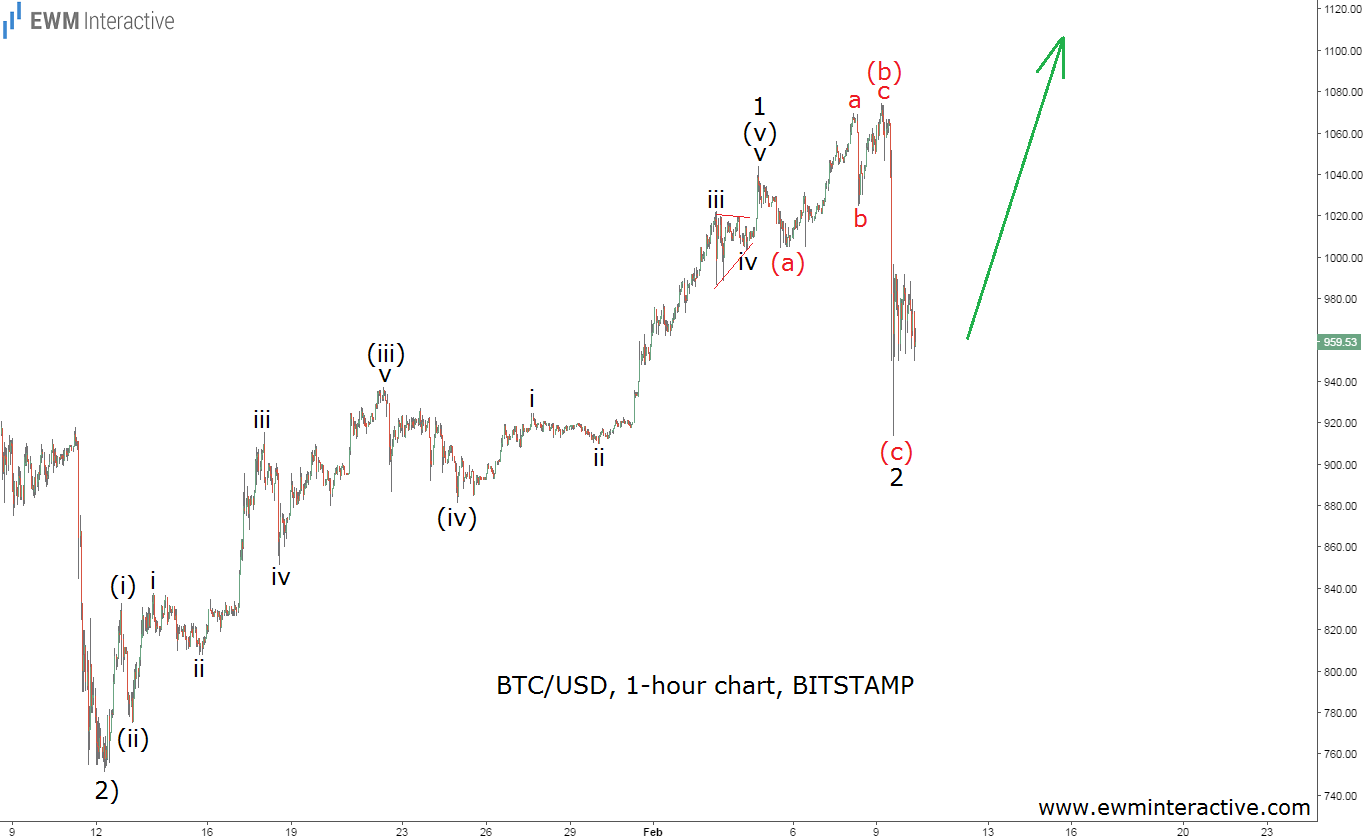
Bitcoin’s hourly chart makes the rally from $751 to $1075 visible. We bet you are no longer amazed to find out that it consists of five waves and the fifth one – (v) – is extended. The difference here is that wave (v) of 1 actually terminates at $1044. The rest of the price action seems to be an expanding flat, whose (b) wave climbs to $1075. Soon after that, the sharp and fast wave (c) of 2 wreaked havoc among bitcoin investors again by plunging the price of their beloved cryptocurrency to $913.73. Another textbook example of a fifth wave extension wiped out almost completely.
So what is the lesson we have learned from Bitcoin’s past? If, after e strong rally, it feels like the only way to go is up, it will probably go down very soon. If it feels like nobody wants it anymore and the price is plunging at a record pace, it is likely to start rising again. The very decentralized nature of Bitcoin allows people’s basic emotions and instincts to materialize and produce those manic-depressive cycles we just examined.
If this analysis is correct, the next bull run should be born from yesterday’s crash. Time for another mania?
