A Better Way To Use P/Es
There has been an ongoing debate about market valuations and the current state of the financial markets. On one hand, the “bulls” use forward price-earnings ratios to justify current valuation levels while the the “bears” cite trailing valuations based on reported earnings per share. The problem with both measures is that valuations, at any specific point in time, are horrible portfolio management tools.
[Note: One of the most egregious fabrications used by Wall Street to try and sell individuals investment products is using forward P/E ratios based operating earnings (earnings before reality) as compared to historical trailing P/E ratios based on reported earnings]
One of the primary problems with fundamental measures, such as P/E ratios, is the “duration mismatch.”
“What is truly ironic is that when it comes to buying ‘crap’ we don’t really need, people will spend hours researching brands, specifications, and pricing. However, when it comes to investing our ‘hard earned savings,’ we tend to spend less time researching the underlying investment and more time fantasizing about our future wealth.”
This “mentality” leads to what I call a “duration mismatch” in investing. While valuations give us a fairly good assessment about future returns, such analysis is based on time frames of five years or longer. However, for individuals, average holding periods for investments has fallen from eight years in the 1960’s to just six months currently.
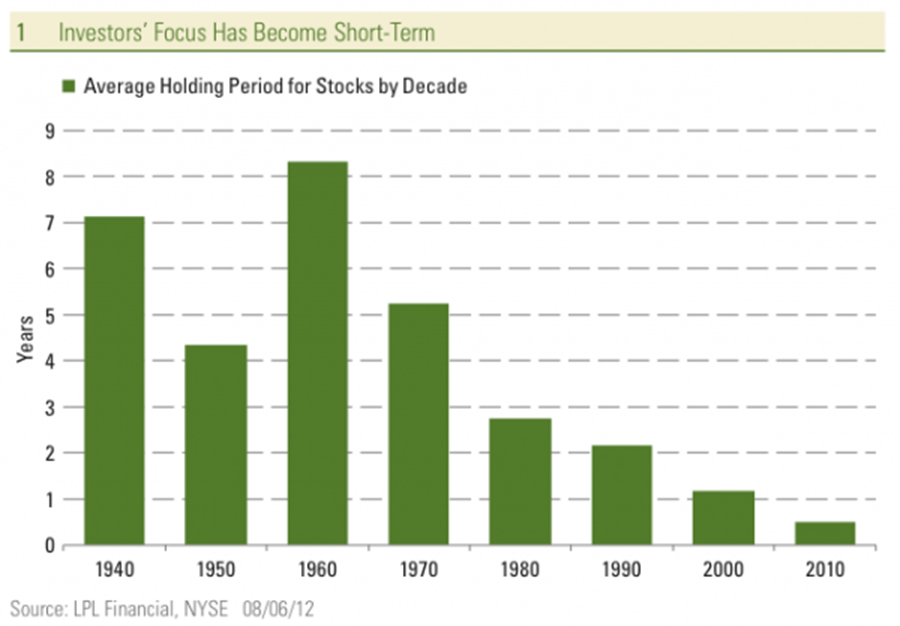
The point to be made here is simple. The time frame required for fundamental valuation measures to be effective in portfolio management are nullified by short-term investment horizons.
It is critical to understand that the current LEVEL of valuations are only useful in determining what the long-term return will be. This is something I have discussed many times previously as it relates to your financial planning specifically.
More importantly, every bull market in history has ultimately crumbled under the weight of fundamental realities. Despite the many hopes to the contrary, this time will be no different. But rather than arguing absolute valuation levels and future expected returns; P/E ratios can also be used to tell us much about the current trend of the markets as well as major turning points.
The chart below of the S&P 500 shows the monthly P/E ratio (using Dr. Robert Shiller’s data) going back to 1881.
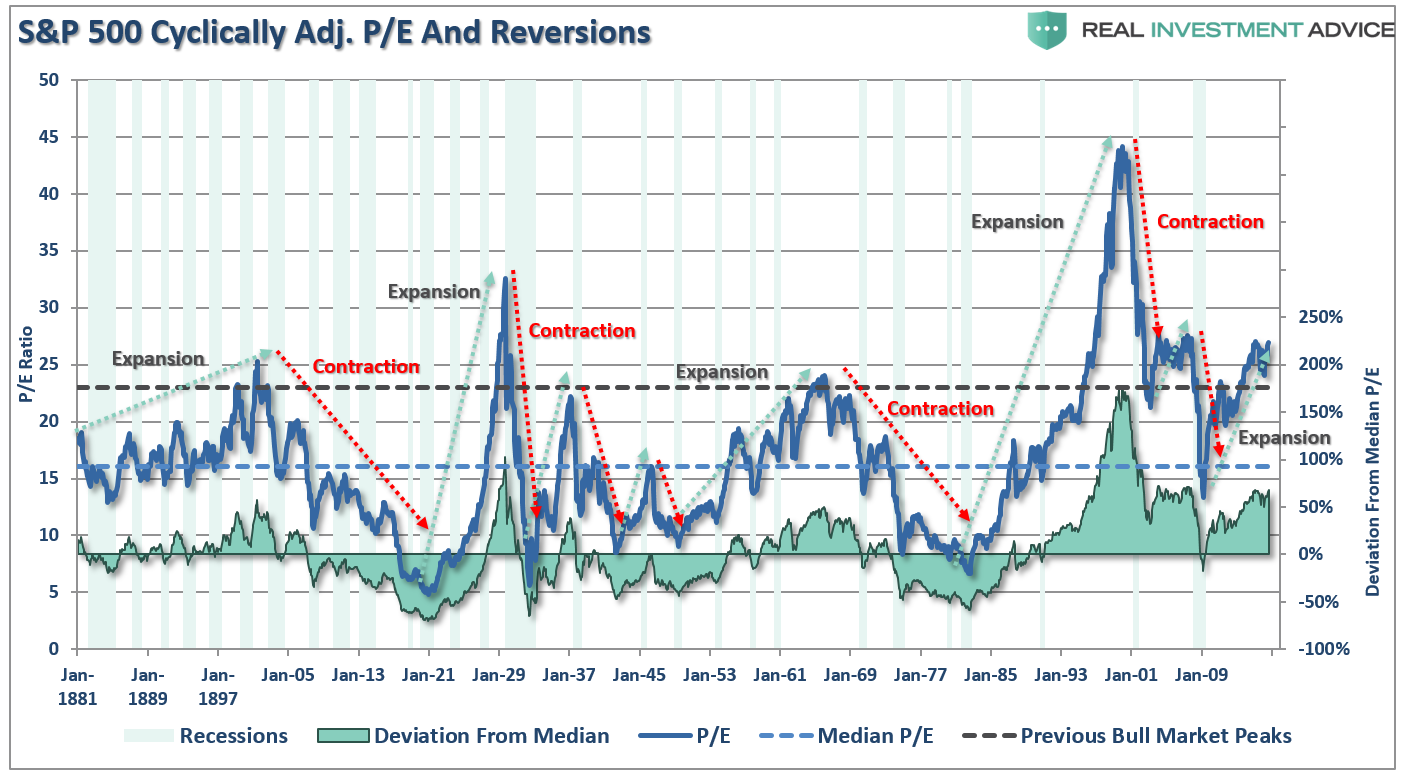
There is something about P/E ratios that is rarely discussed by the financial media which is whether valuation levels are “expanding” or “contracting.” I have noted the major periods of multiple expansions and contractions. (The green shaded area is the deviation of current multiples from the long-term median.)
I have smoothed the data in the chart above with a 12-month average to better identify the “trend” of valuations as compared to the S&P 500 as shown in the chart below.
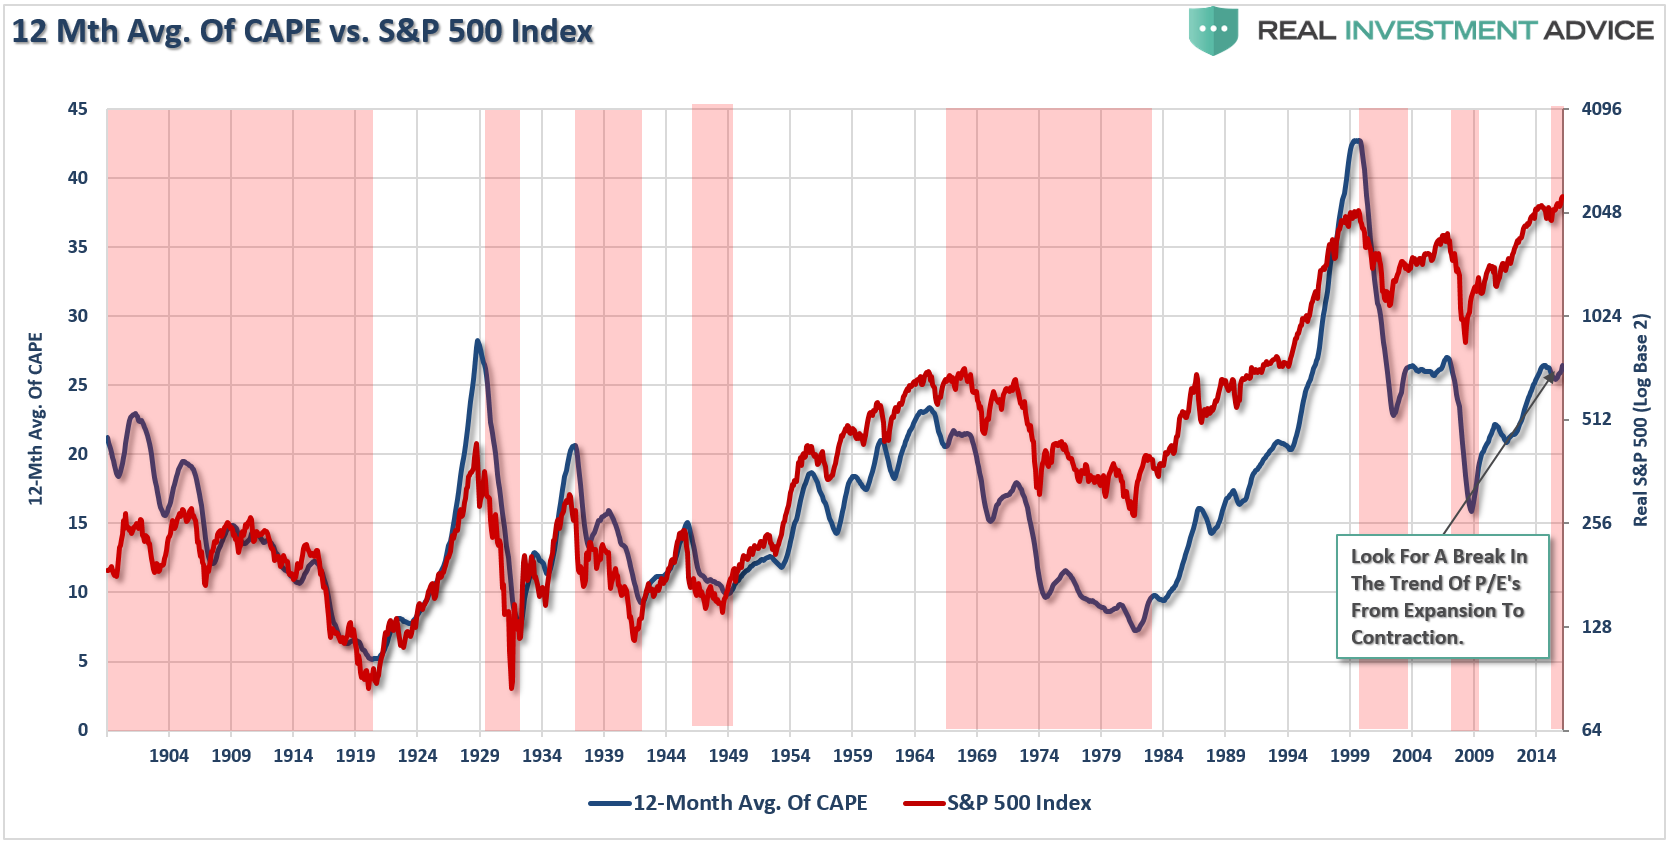
Not surprisingly, we find that periods where multiples are “expanding” are correlated to rising asset prices and vice-versa. Therefore, viewing changes in the direction (or trend) of valuations can provide some clue as to changes in market cycles. This is due to the fact that changes in price (“P”) has a much greater near-term impact on valuations than earnings (“E”). While I am NOT suggesting that earnings are unimportant, changes to earnings move at a much slower pace than price and, therefore, has a muted effect on the directional changes to the overall P/E ratio.
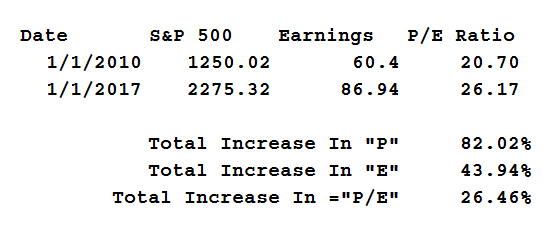
Since 2010, almost 2/3rds of the increase in the P/E Ratio has come from price rather than earnings growth. The same is true during declining markets when dramatic changes in price have a much bigger impact on valuation changes.
Importantly, I am NOT suggesting that P/E’s could or should be used as a “market timing” tool. However, it is quite clear that over shorter-term time frames the directional trend of valuations, rather than the absolute level, is much more telling.
Currently, the ongoing multiple expansion remains supportive to overall stock prices. This is one primary reason why my portfolio allocation model remains fully invested. However, this does not mean that you should go “diving” headfirst into the pool either. The low-hanging fruit has already been harvested and, as noted above, future returns on investments made today are likely to be disappointing.
Bank Loans Issue Warning
At the heart of every major economic expansion in history is lending. Not surprisingly, as shown in the chart below, lending tends to lag changes in the overall economic growth rate. This is because, of course, businesses tend to want confirmation of improvement in the economy before taking on extra debt. Conversely, debt is then liquidated through debt reductions, forced payoffs or defaults during an economic decline. This correlation is shown below.
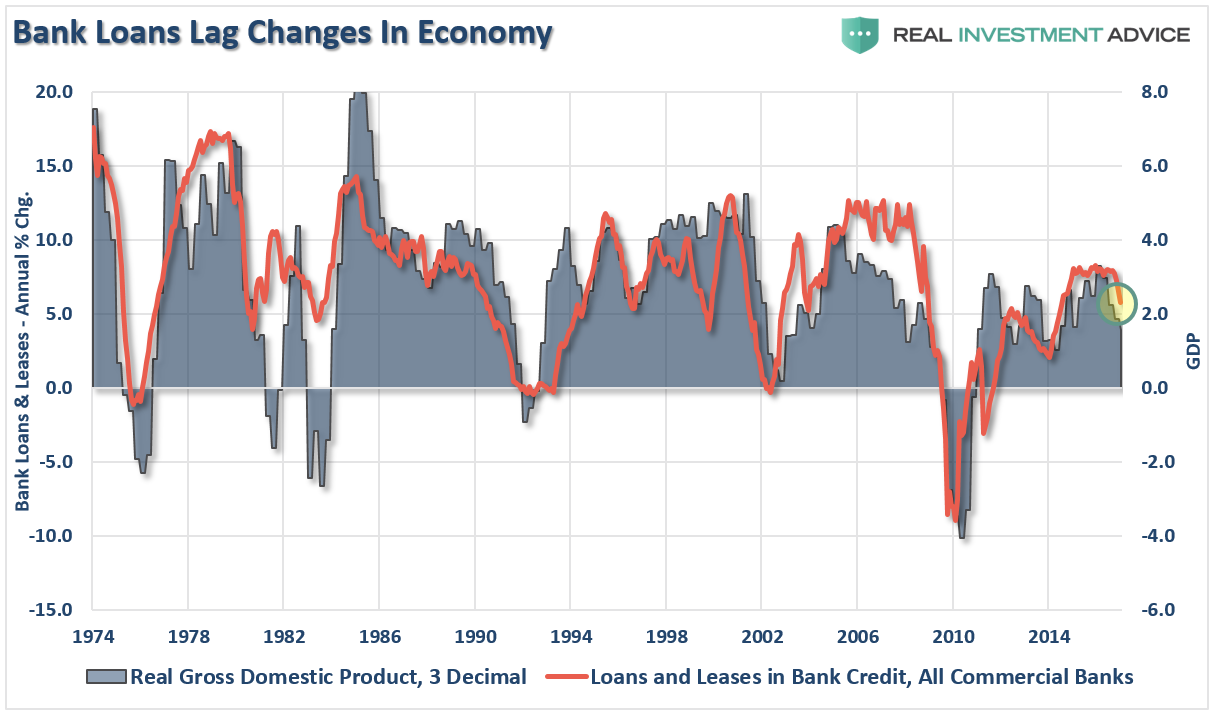
The downturn in commercial loans and leases, while early, should issue a sign of caution to investors about applying too much hope to the current administration to spark an economic rebound in the near term. While tax cuts, repatriations, and tax reform may indeed provide a boost to bottom line earnings, as I have stated previously, there is likely going to be little throughput into the economy unless there is a significant ramp up in consumer demand. But therein lies the problem:
“Here is another problem. While economists, media, and analysts wish to blame those ‘stingy consumers’ for not buying more stuff, the reality is the majority of American consumers have likely reached the limits of their ability to consume. This decline in economic growth over the past 30 years has kept the average American struggling to maintain their standard of living.”
Without the end demand from consumers to push companies to expand production, increase employment and raise prices, there is little impetus for companies to expend capital. The chart below shows the relationship between the extensions of loans and leases as it relates to private fixed investment. Despite hopes that companies would deploy borrowed capital into fixed investment to expand production leading to more job creation, this has not been the case. The ongoing decline in fixed investment continues to suggest an ongoing caution by business owners in deploying capital in productive manners but rather through leverage capital to increase productivity and financial engineering.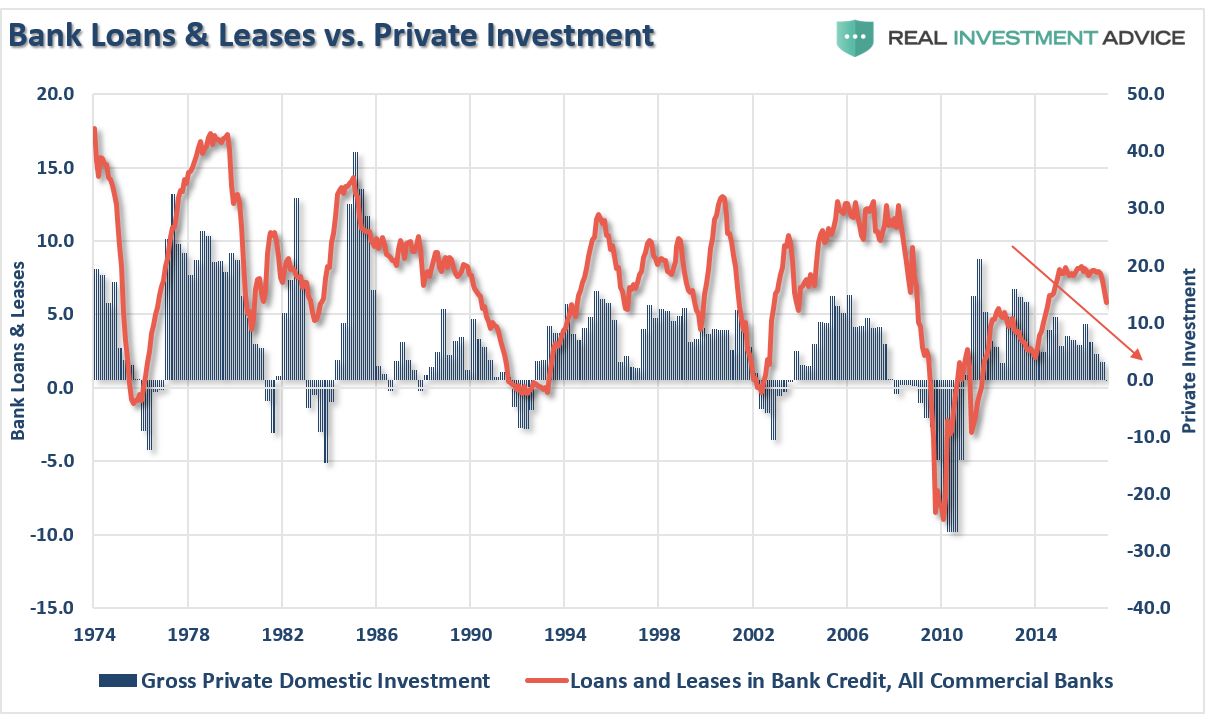
The lack of deployment borrowed capital can be clearly seen in the relationship between loans and leases and monetary velocity. While bank loans have increased since 2010, as financial engineering to boost earnings per share to offset weak revenue growth surged, the movement of money through the economic system has continued to plunge. Hence, this is why, despite soaring earnings and stock market prices, the economy has continued to stumble along at 2% annual growth rates as the economy remains starved of monetary flows.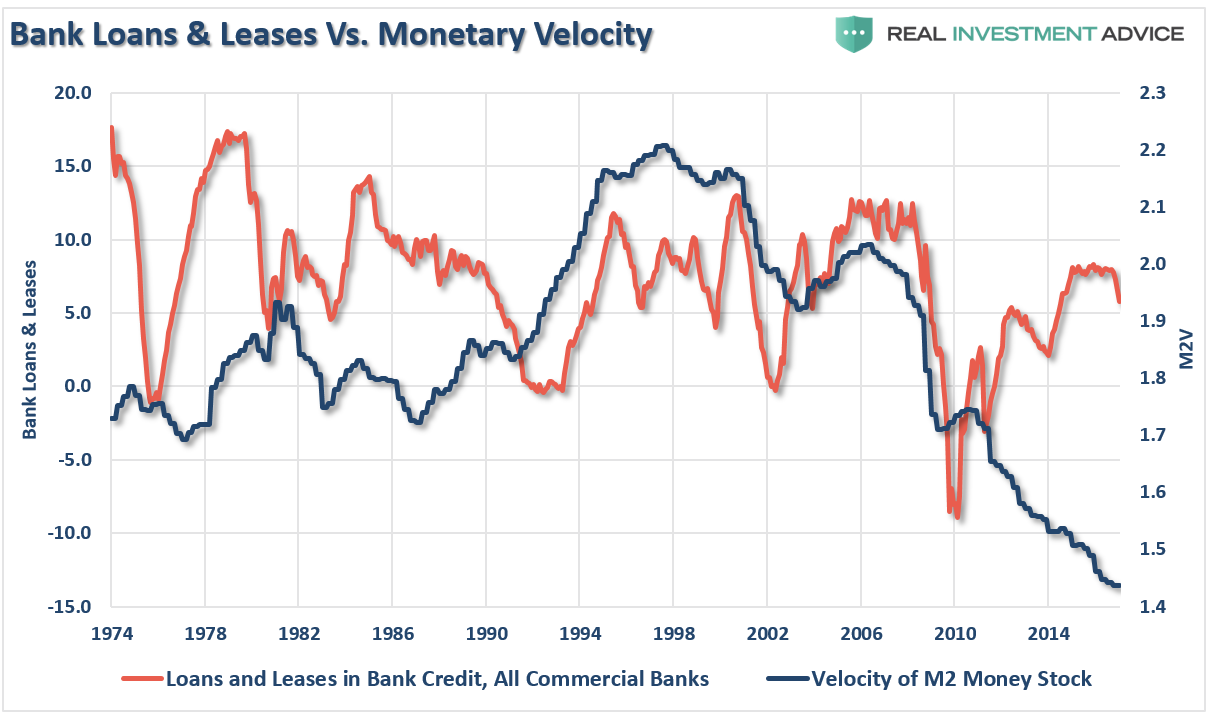
Again, this indicator is very early in its suggestion of weakening demand for credit. However, given the very late stage of economic expansion, this could well be an early warning sign worth paying attention to.
It’s Been Quiet – What Happens Next?
As I was catching up on my reading this morning, this comment from the WSJ caught my attention:
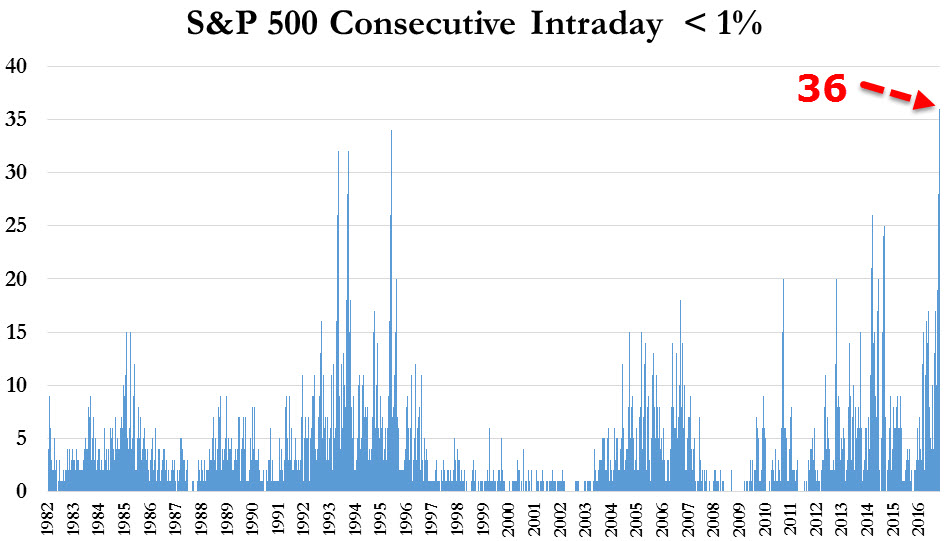
“The S&P 500 hasn’t experienced a daily trading range of 1% or greater for 34 consecutive trading sessions, the longest streak since 1995, according to the Journal’s Market Data Group.
Should the market stay stuck in the doldrums on Monday, it would be the longest streak dating back to at least 1974, according to Thomson Reuters data. And guess what? The S&P 500 has inched down 0.2% in recent trading, putting the record in reach.
The average daily range between a session’s intraday high and low over that stretch, dating back to Dec. 14, is just 0.54%, according to FactSet. That compares to the S&P 500′s average daily trading range in 2016 was 0.96%.”
The reason this was interesting is because of something I was discussing last year during the month of September:
“The bulls and the bears have met at the crossroad. However, neither is ready to commit capital towards their inherent convictions. So, for 43-days, and counting, we remain range bound waiting for what is going to happen next.”
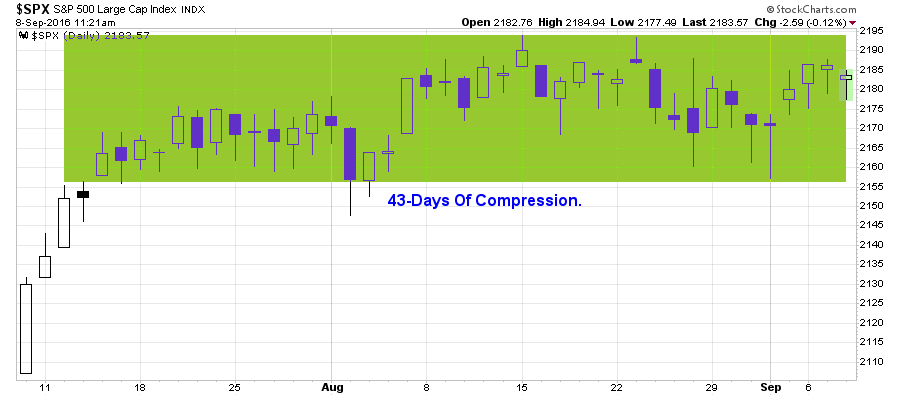
Let me remind you how that ended.
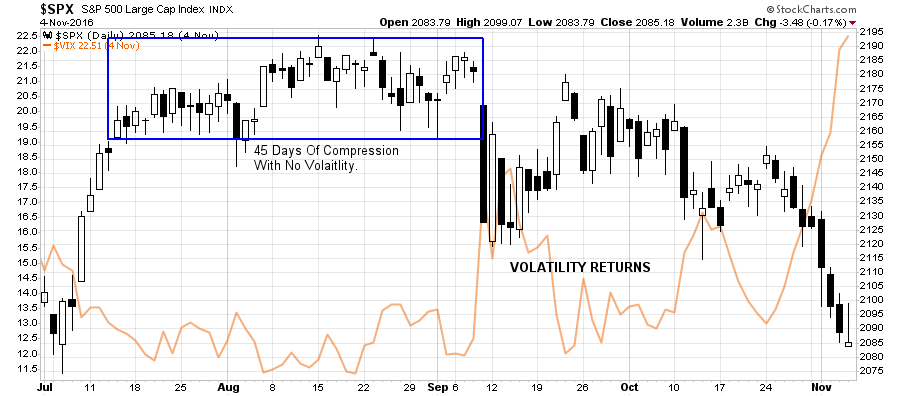
So, here we are once again. Since December the 15th, there has been little volatility in the market. This has lured investors into the same false sense of security seen last year before the rout heading into the November election.
Of course, the problem is we simply don’t know for sure which way this “historically tight trading range” will resolve itself, or when. What is for certain, is that it eventually will. The problem for investors is the “bet wrong” syndrome that occurs in times like this.
I know. It’s boring. We all want to “DO SOMETHING.” But that is simply your emotions at work.
In investing, sometimes the best thing “TO DO” is to “DO NOTHING.” This is where having the patience to wait for the “fat pitch” becomes much more difficult, but more often than not, provides the best results.
While we remain in the seasonally strong time of the year, a short-term correction remains likely as I detailed previously in “Buy The Dip?”
“Importantly, I have noted with vertical dashed red lines the buy and sell indications relative to the markets subsequent direction. In each case, a registered sell signal at the top of the chart, and confirmed by a reversal of the bottom indicator, have led to short and intermediate-term corrections in the market. These two signals should not be ignored.”
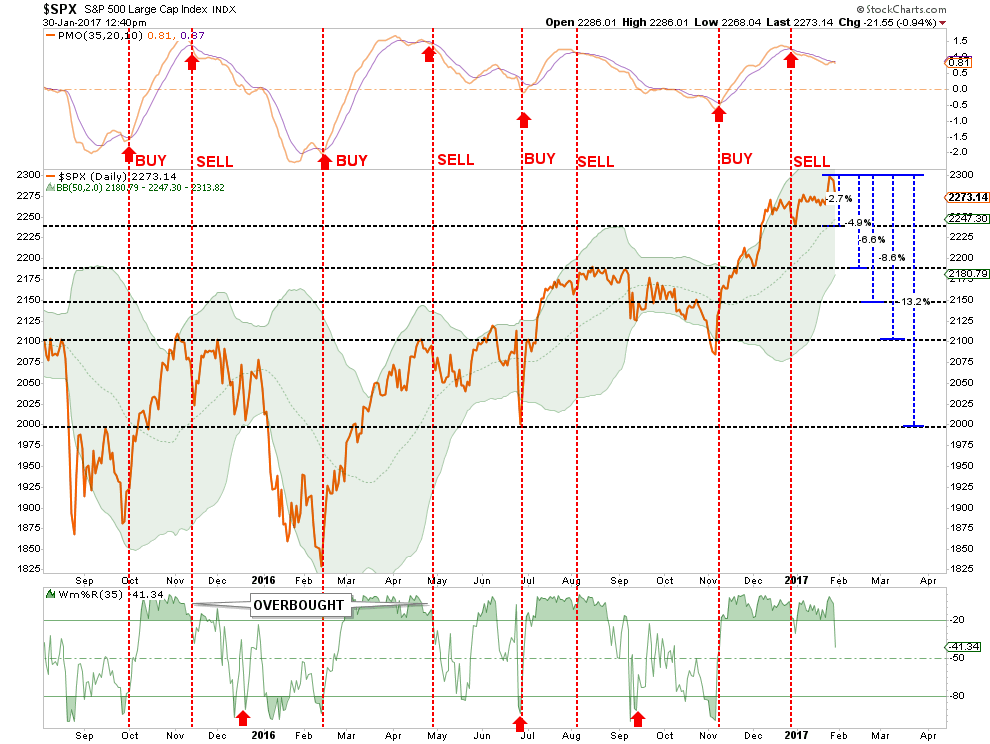
“In this analysis, the correction could be as small as 2.7% or potentially as large at 13.2%. This is quite a dispersion of outcomes and one we will only know with certainty after the fact. However, recent history has suggested that similar setups have seen deeper corrections so such risk should not be readily dismissed.”
Given the overall optimism of the markets, currently based solely on “hopes” of fiscal policy forcing fundamentals to catch up with price, the most likely outcome is the market finding support between the 4.9% and 6.6% correction levels. This should not be any surprise since the markets have suffered 5% corrections, or more, with regularity over the past couple of years.
Just some things I am thinking about.
