While the NASDAQ has been drifting sideways over the past few weeks, select leading growth stocks have been forming bullish consolidation patterns that could trigger breakouts to explosive moves higher. Below we'll break down three of our top picks.
Even in the most bullish stock market, the best growth stocks do not go straight up forever.
Although the NASDAQ Composite remains in a strong bull market, the benchmark tech index has been in “chop mode” since July 13.
However, a few leading growth stocks have been taking advantage of this choppy price action by digesting their recent gains and forming new, tight-ranged bases of price support that could eventually fuel their next big advances.
Identifying healthy price consolidation in top stocks
When leading growth stocks take a rest, they either quickly pull back from their highs (correction by price) or trade in a sideways consolidation pattern (correction by time).
Each of the three growth stocks below are setting up for their next major rallies have been consolidating in a tight, sideways range.
There are two main factors we look for to confirm a stock’s consolidation pattern is healthy:
- 10-week moving average support – During periods of market consolidation, a few weeks of rest in leading growth stocks allows for the 10-week moving averages to rise up to provide support near the current price. This is similar to the pivotal 50-day moving average, which is typically provides strong support in uptrending stocks.
- Lighter volume during consolidation – While breakouts should always be backed by monster volume surges, it’s the opposite situation during periods of consolidation. A strong stock’s volume should decline significantly when trading in a sideways range after a massive rally. This occurs as active swing traders look elsewhere as the stock transitions from trend to chop mode. Volume dries up because the stock is no longer on every trader’s radar during periods of correction. Higher volume consolidations, on the other hand, are usually bearish and indicate institutional selling into strength.
After four to five weeks (or more) of choppy, sideways price action, top stocks may be poised to once again break out to another leg higher within the established uptrend.
These 3 growth stocks may soon be ready to rip higher:
1. Lululemon
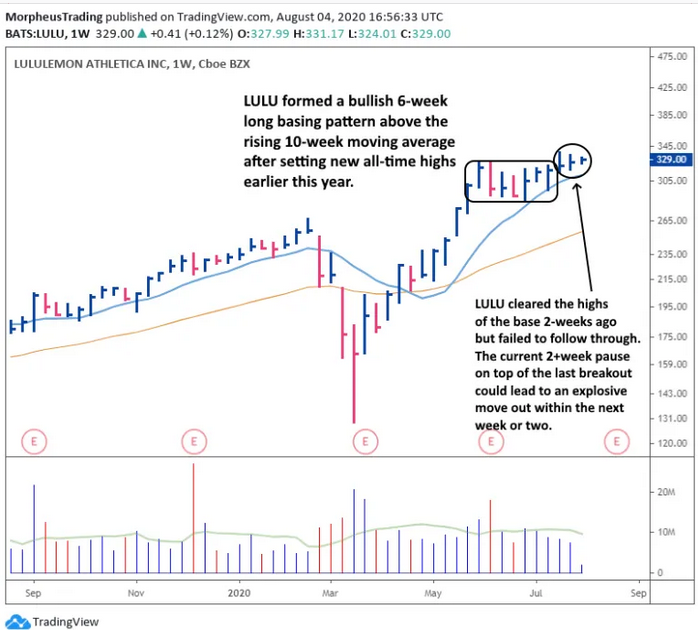
Lululemon Athletica (NASDAQ:LULU) cleared the highs of a tight-ranged, flat base pattern two weeks ago, but failed to follow through.
The price remains in a narrow range, and is now holding above the highs of its last base. If not already long, LULU should be monitored for a breakout entry.
On the annotated weekly chart below, notice how the tight consolidation has been coiling like a spring that’s ready to pop:

2. Okta
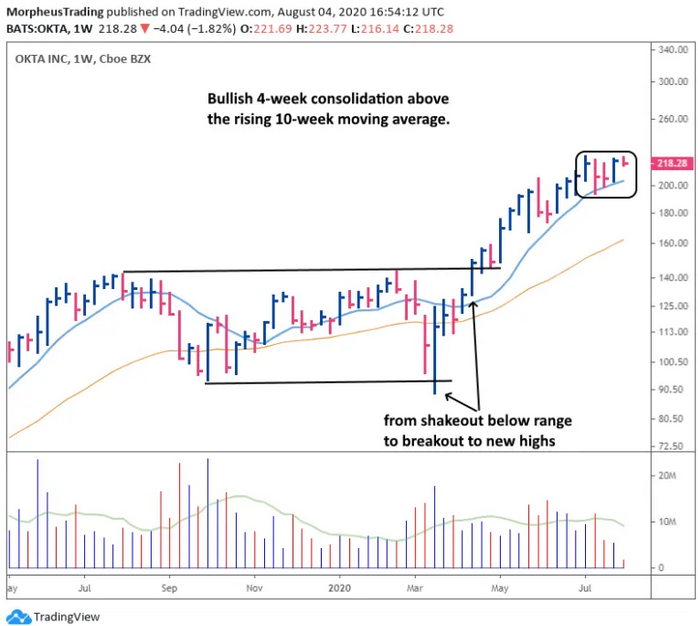
After an explosive breakout to new highs earlier this year, Okta (NASDAQ:OKTA) found support a few weeks ago, at the first touch of its rising 10-week moving average.
This base has been enabling OKTA to digest the gains of its recent advance. A move above the high of the range is the logical buy point if not already long with full size:

3. Zoom Video
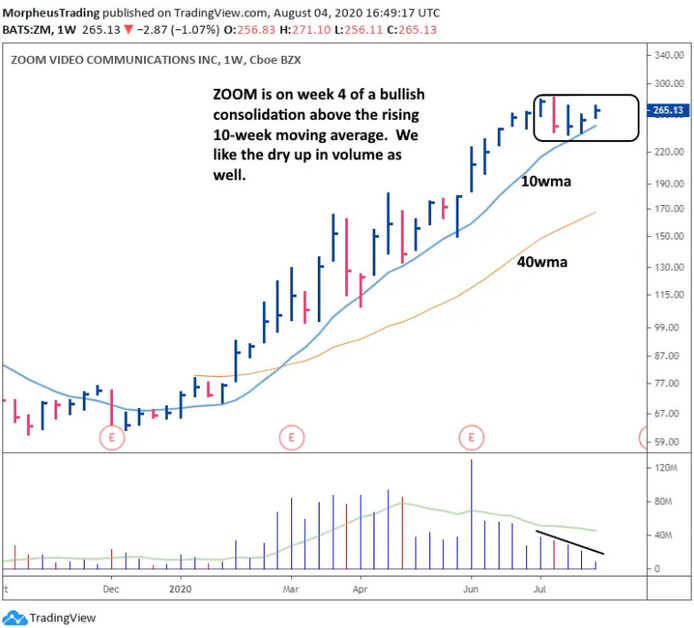
Zoom Video Communications (NASDAQ:ZM), now a work from home household name, rallied 50% from its last base in just seven weeks–a pretty explosive move.
Since this advance, the price found support last week, when ZM reversed just 15 cents shy of its rising 10-week moving average.
We obviously don’t know whether or not ZM is ready to move out this week or next, but we already established a half position at the $257 level:

