CNBC commentators and Bloomberg analysts have spent the last few months explaining how the Federal Reserve’s measured withdrawal (a.k.a. “tapering”) from electronic dollar creation (a.k.a. quantitative easing) is a sign that the U.S. economy is capable of standing on its own. Personally, I believe that it should be allowed to stand on its own regardless; it has been five years since the collapse of the financial markets. The questions before us, however, are whether or not the U.S. economy has transitioned to a self-sustaining creature and whether or not investors are embracing the Fed’s expressed confidence.
On the first issue, it is difficult to see how the U.S. economy has made the transition already. Recent data suggest that manufacturing is slowing, mortgage applications are falling and full-time positions are difficult to come by. This is not to suggest that all incoming information has been dismal. The service sector expanded briskly in January and weekly jobless claims remain relatively muted. Nevertheless, at this point in the five-year, Fed-fueled recovery, it seems reasonable to expect most data to significantly exceed expectations rather than a mix of modest positives and ugly negatives.
On the second issue, investors are not expressing the kind of confidence that most had anticipated entering 2014. When the biggest winners of the last two tapering announcements (i.e., $85 billion down to $75 billion, $75 billion down to $65 billion) have been treasury bonds, utility stocks, preferred shares, precious metals and gold miners, one is left wondering about Wall Street’s conventional wisdom. Granted, five weeks does not a trend make. That said, there are a number of ETF indicators that deserve your attention at this moment.
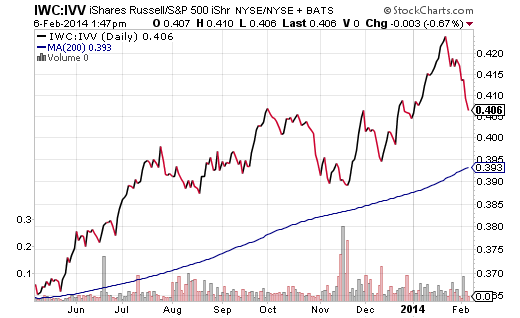
1. Smallest Public Company Shares Versus Largest Public Company Shares. One of the long-running realities of the current bull market uptrend is that small cap stocks have handily outperformed their larger company counterparts. Yet, since the mid-January peak for the overwhelming majority of broader market U.S. stock ETFs, funds like iShares Russell 2000 Small Cap (IWM) and iShares Microcap (IWC) have been noticeably weaker than S&P 500 proxies like iShares S&P 500 (IVV). One can see the development is the IWC:IVV price ratio below.

The evidence is hardly overwhelming at this stage. What’s more, generalized correction fears can stimulate profit-taking on the biggest winners first. There is another way of looking at the possible development, though. Small cap stocks often underperform large caps when investors believe the domestic economy is in danger of weakening. In other words, a falling IWC:IVV price ratio is worthy of monitoring.
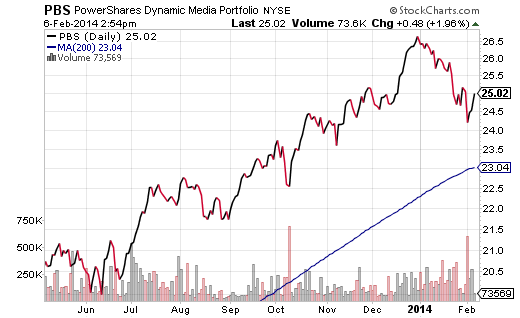
2. Hottest ETFs Under Heavier Selling Pressure. Year-over-year, 5-star rated Guggenheim Spin-Off (CSD) amassed 34%. Similarly, alternative energy via PowerShares WilderHill Clean Energy (PBW) claimed 42%, while PowerShares Dynamic Media (PBS) with super stand-outs like Google (GOOG), Disney (DIS) and DirectTV (DTV) vaulted a staggering 45% over the same period. Unfortunately, these ultra-hot ETFs have been losing ground at a faster pace than the market at large. And while none of these assets have tested the long-term 200-day moving average the way that the Dow Industrials had recently, the heavy volume of liquidation on growth assets bears watching.

3. Mid-Cycle Phase or Late-Cycle Phase of the Business Cycle. Most analysts would likely describe the current economic environment as one with a moderate rate of growth, strong corporate profitability and an accommodative/neutral monetary policy backdrop. The description best fits the notion that the U.S. is in the middle of its economic expansion. Along these lines, investors that employ the business cycle to overweight and underweight assets accordingly often favor the energy and industrial sectors in the mid-cycle phase; they typically underweight utilities and materials here.
Yet, a funny thing happened on the way to the allocation party. Over the last month, the best performing sectors have been utilities and health care, as SPDR Select Sector Utilities (XLU) and SPDR Select Sector Health Care (XLV) have produced 2.5% and -0.4% respectively. The outperformance by these segments is more typical of a late-cycle phase. Similarly, industrials and energy were some of the month-over-month underperformers with SPDR Sector Select Industrials (XLI) and SPDR Select Sector Energy (XLE) logging -4.0% and -5.2% respectively. Again, the sector percentages seem to point more to a late-cycle phase of a business cycle rather than a mid-cycle phase of an economic recovery.
I am hardly predicting a recession here. I am simply noting that investors, myself included, have shifted to more defensive areas that are more common during a slowing down of the economy. And with the Federal Reserve presumably committed to winding down its quantitative easing (QE 3) experiment, as well as elevated measure of volatility in equity trading, a defensive posture certainly seems warranted. What would change my mind? Should the Fed suspend an increment of tapering or even decide to inject more liquidity, expect asset prices to inflate once more and investors attempt to take advantage.
Disclosure: Gary Gordon, MS, CFP is the president of Pacific Park Financial, Inc., a Registered Investment Adviser with the SEC. Gary Gordon, Pacific Park Financial, Inc, and/or its clients may hold positions in the ETFs, mutual funds, and/or any investment asset mentioned above. The commentary does not constitute individualized investment advice. The opinions offered herein are not personalized recommendations to buy, sell or hold securities. At times, issuers of exchange-traded products compensate Pacific Park Financial, Inc. or its subsidiaries for advertising at the ETF Expert web site. ETF Expert content is created independently of any advertising relationships.
