
The profits you want are right around the corner.
I know that's hard to believe as the markets come unglued, but hear me out.
Playing offence is always more profitable over time than trying to avoid a downturn. Not sometimes, not at a point in time – always.
On March 6 I suggested you consider the Clorox Co (NYSE:CLX). It's just hit new all highs of $205.36. I suggested investors avoid Boeing Co (NYSE:BA) at all costs in the aftermath of the MAX situation, when it was trading at nearly $360, and it broke $100 a share this morning.
People ask me frequently "How do I know?"
I don't.
I simply have two things working for me that every investor needs:
a) perspective drawn from 37 years in global markets,
and b) world-class analytics that help me see what could happen next a little more clearly.
I don't have to do anything except pay attention. And, of course, buy "must have" companies the world can't live without.
I want you to have the same advantage. That's why I'm sharing three (normally) proprietary charts I look at every day.
One of the single most significant problems individual investors have at times like the present is the inability to see the bigger picture. Many want to, but they can't, simply because they're limited by experience, by access or simply by emotion.
What you want to do is develop the overarching understanding and perspective needed to make money consistently in all kinds of economic conditions even when the wheels seem like they're coming off the proverbial wagon.
The single most important concept is also the toughest to internalize: The markets really do have an upward bias. That's why they reward discipline, not a roll of the dice.
Take a look.
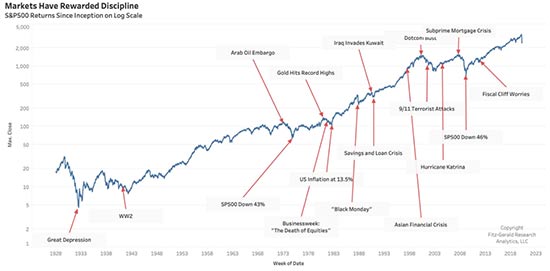
This chart, more than any other, is why I know that market angst comes and goes. It's also why I take great comfort in the human spirit and why I know we will get through the coronavirus. It's worth noting that I take a good hard look at this chart every time I start to feel fear creeping in around the edges. It's my "go to" at SHTF moments.
Then there's volatility. Many investors just want the pain to stop, me included.
It will. Volatility comes and goes in clusters, and you can see that very clearly in this chart.
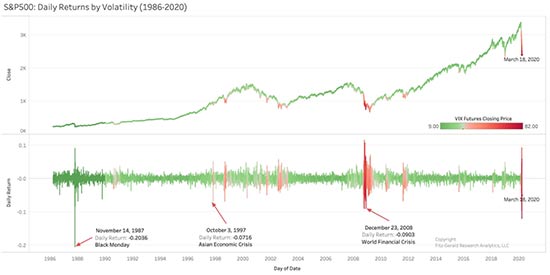
More than any other data set, this is the one that supports buying when others are "despondently" selling, to quote the late Sir John Templeton, who was one of the greatest stock pickers and investors of all time. Templeton famously borrowed $10,000 on the eve of World War II and bought 100 shares of every stock trading on the New York Stock Exchange for under $1. All but four would turn out to be profitable investments. He would go on to refine that philosophy and make so much money that he gave away more than $1 billion before he died.
This chart is also why there is no doubt whatsoever in my mind that what's happening right now is a "Templeton Moment" for every savvy investor who understands the profit potential that's being created by such turmoil.
The world's best companies are being put on sale at once-in-a-lifetime prices. More importantly, they're not just "cheap" but, rather, extraordinarily valued!
The fact that you, like many investors, may be scared out of your mind is a reinforcing signal. Investor sentiment at times like this is almost always a well documented bullish indicator.
And, finally, here's what price movement looks like by sector. This chart is important because it reinforces what a load of hooey Wall Street's conventional diversification models are. "They" tell you to diversify because not everything moves at once.
Yeah? Sure as heck looks that way to me.
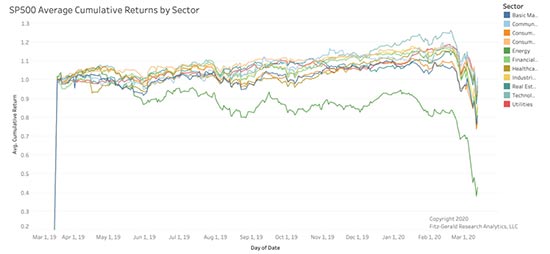
The only standout here is energy, which is being priced like "gas-aggedon" is upon us. Only we know that's not true either.
Many of the world's top scientists think it would take decades to shift away from fossil fuels, even if there's a substitute for oil tomorrow.
This herd behavior is precisely why I pioneered the 50-40-10 Model for individual investors seeking a conservative edge over Wall Street's tired, flawed thinking. It's based on something called "risk parity" rather than conventional thinking on diversification.
Many individuals have never heard the term, but savvy institutional investors have used risk parity oriented models to help run billions of dollars in pension funds, endowments and hedge funds.
How that played out? Pretty damn well, if I do say so myself.
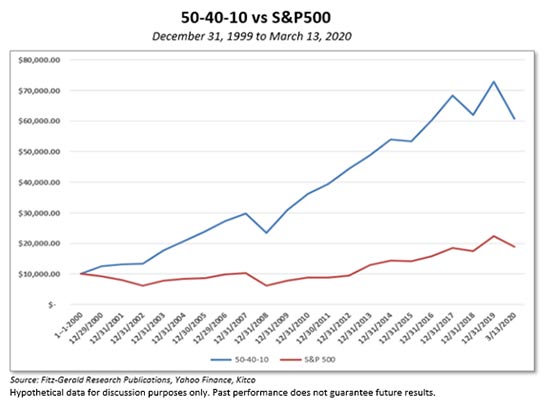
Here's a chart showing how the Model 50-40-10 Portfolio has performed since Jan. 1, 2000 – a period that includes the dot.com crash, the global financial crisis, and now the coronavirus pandemic.
As you can see, there are ups and downs just like the S&P 500 Index I'm comparing it to. Every investment involves the risk of loss. There's just no getting around that. The key, though, is that risk-parity models like this one can allow investors who latch on to this type of thinking to pull far ahead.
Some 444.52% ahead through March 13. That's a $4,192.43 advantage for every $1,000 invested over the same time frame.
A $41,924.33 advantage for every $10,000 invested. A $419,243.30 advantage for every $100,000 invested.
And, a juicy $4,192,433 advantage for every $1,000,000.
Playing offence right now makes more sense than ever against that backdrop. Again, I know that's scary for many investors, but it doesn't have to be. There's nothing that says you must jump in all at once with everything you own. In fact, I'd argue that doing so subjects you and your money to unneeded risk. Especially now.
However, buying the world's best companies is another matter entirely. That's a very different proposition. So much so, actually, that CNBC's Jim Cramer just took a page out of my playbook and told viewers to buy only "essential" companies capable of moving beyond the virus. That's what he calls the "must-have" companies we've talked about.
How?
There is a very real risk that stocks can drop even further as the coronavirus situation deteriorates before it gets better. Many folks who have blindly bought "the dip" in recent weeks are now nursing losses.
Consider changing up your tactics to control risk and avoid that from happening. You can always buy in later when things are clearly on the mend; you'll miss some of the upside but so what.
This is as much a mental exercise as a financial one.
Buy one share at a time even if you have to as a way of keeping your head in the game. Consider selling puts to generate cash as you "go shopping".
Or, consider my favorite Total Wealth Tactic, the Lowball Order for a company like … wait for it …