- Examine 138 REITs for price trend up or down
- 6 simple binary factors establish trend
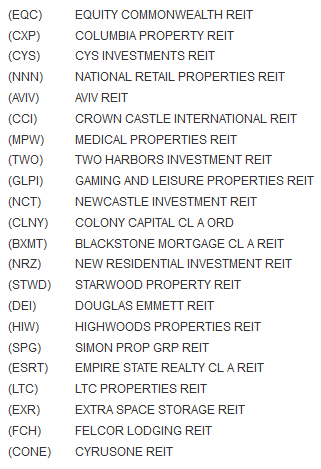
- 21 in up trend, and 13 outperform REIT index.
- 12 mo direction (is the 12 month average now higher than 10 days ago? Y/N)
- 3 month av / 12 mo av (is the 3 month average above the 12 mo average? Y/N)
- 3 mo direction (is the 3 month average now higher than 10 days ago? Y/N)
- 1 mo / 3 mo (is the 1 month average now higher than 10 days ago? Y/N)
- 1 mo direction (is the 1 month average above the 3 month average? Y/N)
- Price / 1 mo (is the last price above the 1 month average? Y/N)
- CYS Investments Inc (NYSE:CYS)
- National Retail Properties (NYSE:NNN)
- Crown Castle International (NYSE:CCI)
- Medical Properties Trust Inc (NYSE:MPW)
- Newcastle Investment Corporation (NYSE:NCT)
- Colony Capital Inc (NYSE:CLNY)
- New Residential Investment Corp (NYSE:NRZ)
- Simon Property Group Inc (NYSE:SPG)
- Empire State Realty (NYSE:ESRT)
- LTC Properties Inc (NYSE:LTC)
- Extra Space Storage Inc (NYSE:EXR)
- FelCor Lodging Trust Incorporated (NYSE:FCH)
- CyrusOne Inc (NASDAQ:CONE)
These 21 REITs out of 138 in the Reuters DataLink database are in up trends (even if ever so slight in some cases). They may or may not be attractive to you by other metrics, but if you prefer to invest in stocks that are rising instead of falling, this batch is a good one on which to focus further fundamental examination.
Articles by Brad Thomas, or other REIT oriented authors may be a good place to begin your research on names from this list that are of interest to you.
Independent of any fundamental views, this is the list of REITs that are moving up to one degree or another.
An up trend in this instance is defined by a binary computer filter of the tilt the tip of several moving averages, and by the stacking of shorter moving averages above longer moving averages. By using a binary (Yes/No?) set of selection criteria carried out with a computer, large numbers of securities can be quickly filtered to identify a list of prospects.
It’s faster than manual inspection and absolutely faithful to the filter criteria, whereas inspection by eye is prone to a certain amount of wishful thinking by giving names you know or like a bit more leeway than other names. Once the binary filter reduces the universe, you can then use all the objective or subjective examination of the charts you like, as well as doing your deep dive into the business itself.
We used what might be called Moving Average Slope and Stacking based on 6 binary Yes/No (1/0) measurements of the slope of the price chart as of Friday April 17, 2015 (shown below listed from most important parameter on top to least important on the bottom):
The first 6 column in this image (header shaded gray) present the results of the 6 binary filter questions. The top 21 of 138 REITs are presented in this image.
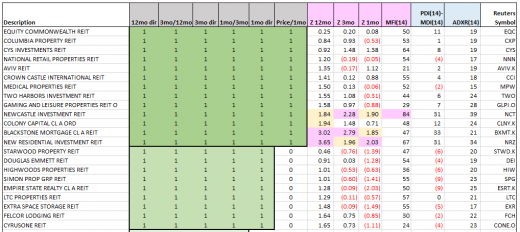
The additional columns provide supplemental objective chart information
Z-Scores: Z-12 mo, Z-3 mo and Z-1 mo present the number of standard deviations the price is from the corresponding 12 mo, 3 mo and 1 mo moving average prices. For Z-scores look out for +/- 2 or more, as being possibly too far from its average to be likely able to maintain that distance. Those >= 2 are shaded pink, and those >=1.80
Money Flow Index: MF14 presents the 14-day money flow index (a volume weighted version of the relative strength index — itself a measure of the tendency of the price to position itself within its average daily range). For Money Flow values over 70 are seen as overbought, and under 30 as oversold). Values
Directional Movement: PDI(14)-MDI(14) indicates short-term trend direction. A positive number means more higher highs were generated than lower lows over 14 days; and a negative number means more lower lows were generated than higher highs. Positive directional movement equals the current high minus the prior high, if the number is positive. Minus (negative) directional movement equals prior low minus the current low. For each period directional movement is positive (plus) when the current high minus the prior high is greater than the prior low minus the current low; and directional movement is negative (minus) when the prior low minus the current low is greater than the current high minus the prior high. The positive and minus directional movements are each averaged over 14 days and then the difference is calculated for PDI(14)-MDI(14).
Average Directional Index Rating, ADXR(14): ADXR is a non-directional trend strength indicator, based on calculation using Positive and Minus Directional Movement data. It has values from 0 to 100. Values above 25 are seen as indicating a “trending” price pattern, while values under 25 are seen as indicating a “non-tending” (rather sideways) price pattern. ADXR shows short-term trend strength and PDI-MDI shows short-term trend direction.
Binary data and Z-scores in the table above were produced using custom formulas in Equis Metastock with data feed from Reuters; and the other data is based on “out of the box” indicators in Metastock.
Note that Reuters adds suffixes to many securities to identify where they are traded.
13 Outperformed Vanguard Equity REIT ETF (ARCA:VNQ):
These 13 REITS outperformed VNQ:
The 3 top performers among them were CONE, NRZ, and EXR, as this chart shows (also shows comparison with an investment grade corporate bond fund iShares iBoxx $ Investment Grade Corporate Bond (ARCA:LQD) (in gold) since some investors have gravitated to REITs as bond alternatives in the past few years).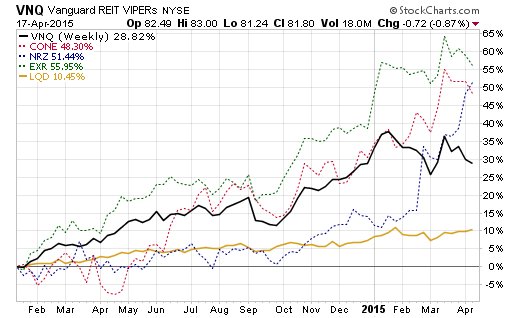
If you would care to have the full list of REITs to see how each REIT scored, it is available without charge to readers who opt into our email list for occasional investment commentaries. Send a request with “REITs 2015-04-17″ in the subject line to
Individual Price Charts: Computer generated binary tabular data is wonderful for sorting through large numbers of securities, and to subject selection to a limited set of strict objective guidelines. In the end, though, the human eye and brain need to look at the whole picture in a price chart with its enormous number of data points.
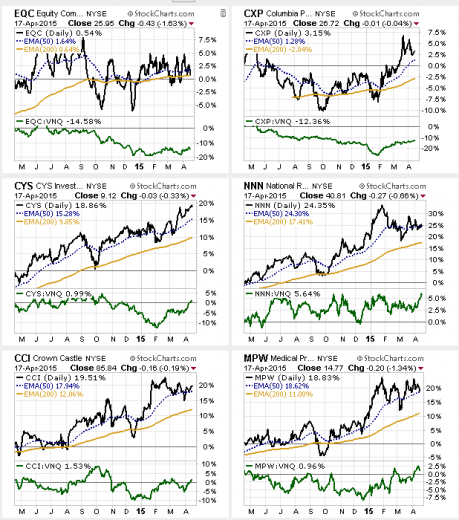
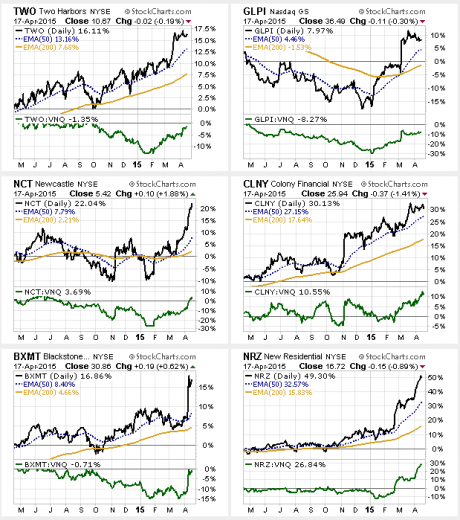
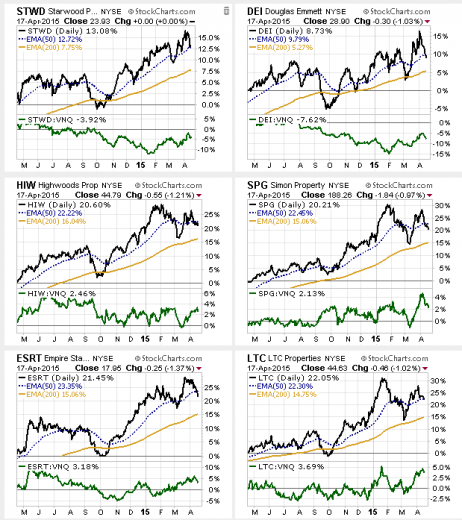
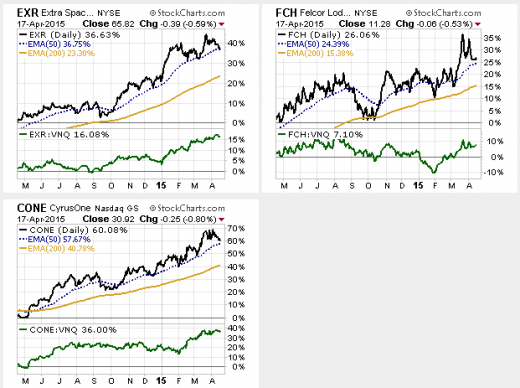
So here they are — charts for each of the 21 REITS, also showing the 200-day and 50-day exponential moving averages, and in the lower panel the ratio of the REIT price divided by the VNQ price.
Good hunting!
