2017 is already halfway in the books and it has been a banner start for exchange-traded funds (ETFs). These prior six months saw nearly $250 billion flow into ETF coffers as both stock and bond indexes surged to new heights. That type of fund flow would typically be indicative of a tremendous full calendaryear.
However, as the bull market steams ahead, investors are throwing their weight behind the minimal cost, diversification, transparency, and liquidity that ETFs are famous for.
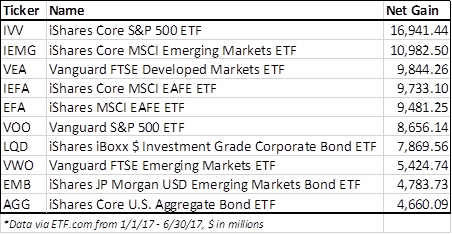
The biggest recipients of this new money are BlackRock (NYSE:BLK) and Vanguard (NYSE:AVD), who easily dominate the competition. These industry titans are the only two companies represented in the top 10 ETFs by net asset flows through June 30. Those ten funds took in a combined $88 billion, which accounts for over one-third of the grand total, according to ETF.com metrics.
The fund topping this list so far this year is the iShares Core S&P 500 ETF (AX:IVV), with nearly $17 billion of additional capital added. That is followed by the iShares Core MSCI Emerging Markets (NYSE:IEMG) with $11 billion and Vanguard FTSE Developed Markets (NYSE:VEA) at $10 billion. The iShares iBoxx $ Investment Grade Corporate Bond ETF (NYSE:LQD) was the top fixed-income recipient of this group with $7.8 billion.

Some notable observations of the top asset gatherers are that all funds are highly diversified and passively managed index solutions. These types of vehicles are most commonly used as core portfolio building blocks to achieve instant exposure to the market. All these funds share the common trait of ultra-low expense ratios as well.
The ETF industry trend of steadily lowering net expense ratios each year continues to benefit investors in these products as well as lure fresh capital for the largest sponsors. More and more funds are sharpening the pencil on costs to stay competitive in the race or risk losing market share.
Another standout point for the group through the first six months of the year is the strength behind foreign stock and bond indexes. Emerging market, pacific rim, and diversified international funds attained better returns than their U.S. counterparts over this period.
Many investors are betting that these areas of the market are ripe as value opportunities because of their lagging returns over the last half decade. The declining value of the U.S. dollar versus other major foreign currencies was another tailwind for international funds as well.
A scan of year-to-date performance figures shows that countries like India, China, and Turkey were three of the top global markets through the first half of 2017. The KraneShares CSI China Internet ETF (NASDAQ:KWEB) gained a healthy +37.92%, while the VanEck Vectors India Small-Cap Index ETF (NYSE:SCIF) jumped +36.69%.
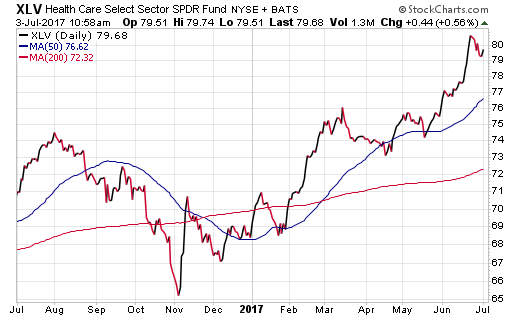
Here at home, the Health Care Select Sector SPDR (NYSE:XLV) was the number one sector of the market with a gain of +15.81%. It barely managed to surpass technology stocks after a second quarter surge from biotechnology helped propel this group to fresh all-time highs.

While it’s difficult to forecast where 2017 will ultimately end in terms of performance, there is strong evidence that the demand for ETFs will continue unabated. It will be interesting to see if any smart beta or actively managed funds ever crack the top ranks in terms of net fund flows. My guess is that the demand for simple index exposure will continue to be favored until we see a strong case to be made for tactical strategies.
The views and opinions expressed herein are the views and opinions of the author and do not necessarily reflect those of Nasdaq, Inc.
Disclosure : FMD Capital Management, its executives, and/or its clients June hold positions in the ETFs, mutual funds or any investment asset mentioned in this article. The commentary does not constitute individualized investment advice. The opinions offered herein are not personalized recommendations to buy, sell or hold securities.
