The Bad News is that the stock market overall looks pretty awful to me. The Good News is that I personally possess almost no “predictive” capabilities. So what I “think” about the markets should mean even less to you then it does to me.
Still, I do study the markets a lot (some might say “too much”) and what I see – objectively – is a U.S. stock market that is still technically in an “uptrend” (based on the current status of several trend-following methods that I follow). What “I think I see” (subjectively) is a U.S. stock market that is forming a major “topping” formation.
The bottom line is: You should be watching the U.S. stock market very closely NOW and in the months ahead. This is a market that (in my opinion) absolutely, positively needs to stage an upside breakout soon (early 2016?) or things could get ugly.
For Comparison’s Sake
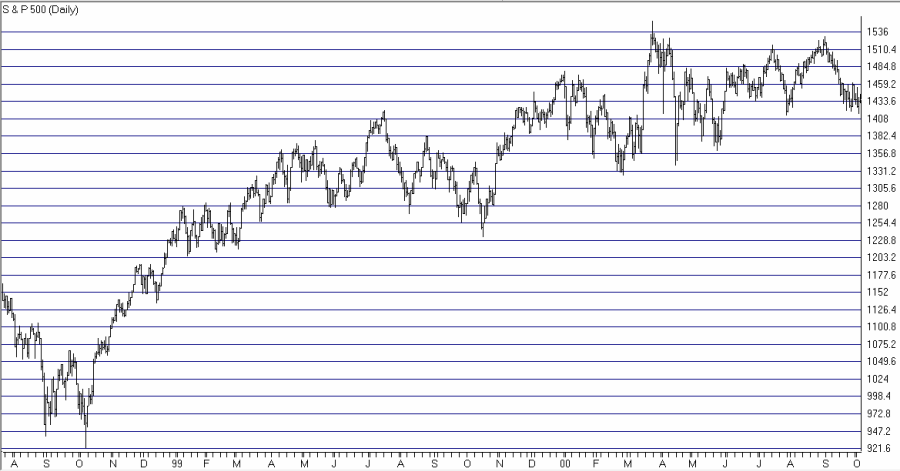
Figure 1 displays the S&P 500 as it topped out in 2000. Note:
a) A big run up followed by
b) A long period of sideways action within a fairly large range
The S&P 500 subsequently declined about -45% over the next 21 months.
Figure 2 displays the S&P 500 as it topped out in 2007. Note:
a) A big run up followed by
b) A long period of sideways action within a fairly large range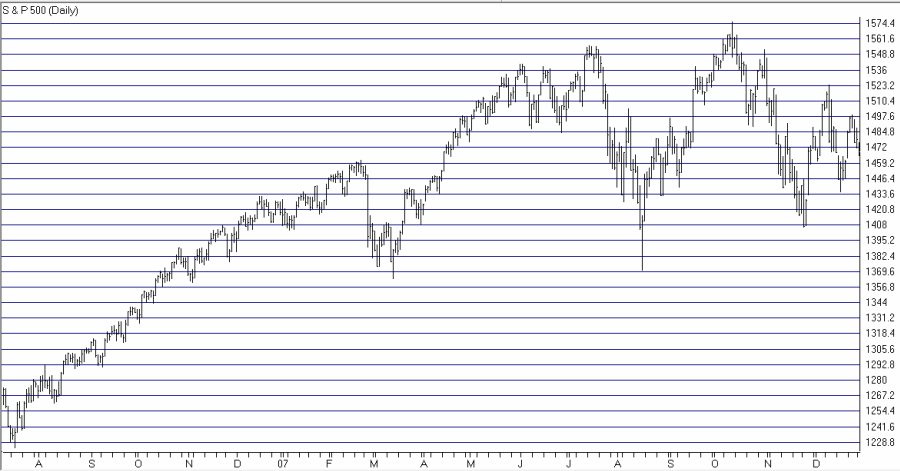
The S&P 500 subsequently declined about -54% over the next 15 months.
Figure 3 displays the S&P 500 in 2015. Note:
a) A big run up followed by
b) A long period of sideways action within a fairly large range.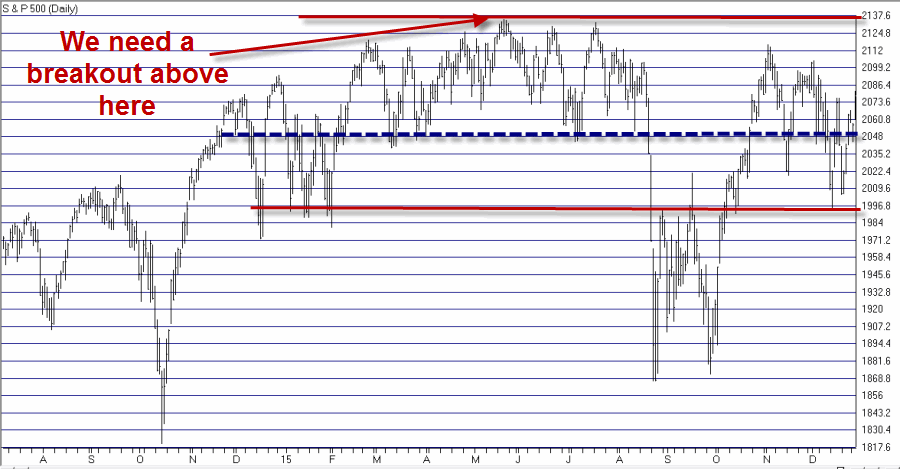
Does Figure 3 resemble Figures 1 and 2 to you? And if so, how worried should we be?
On the Plus Side
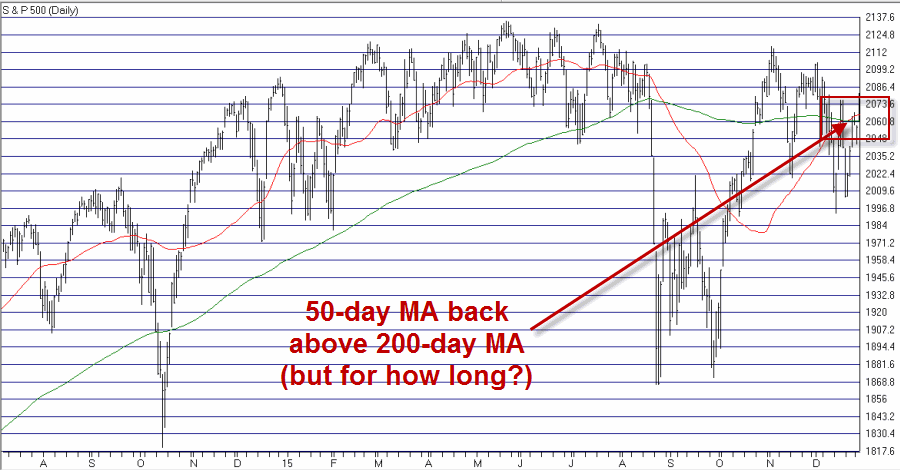
Figures 4 and 5 show two different “trend following” indicators that are both “bullish” at the moment. Figure 4 displays the S&P 500 with the 50-day and 200-day moving averages. The mosr recent sell signal in late August resulted in a “whipsaw” (selling lower and buying back higher). But that is the nature of trend-following indicators. For our purposes:
*50-day>200-day = GOOD
*50-day
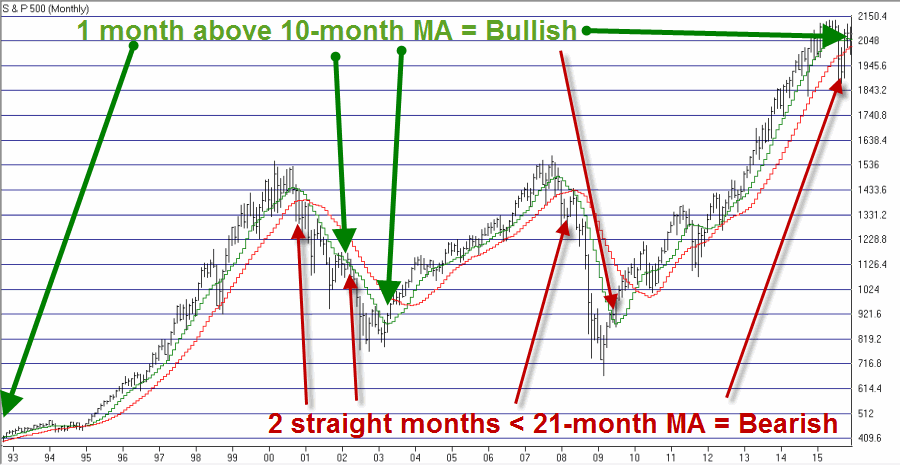
Figure 5 displays the timing method I use in the Alpha Multi-Income Strategy that I manage. Two consecutive monthly closes below the 21-month moving average generates a “sell” signal and a close above the 10-month moving average generates a “buy” signal. The most recent sell signal at the end of September was essentially a “wrost case” event as the stock market turned and rallied hard in October. But again, that is the natre of trend-following. The long-term results for this timing model is far superior to buy-and-hold, but not every signal is a “winner”. For our purposes:
*Unless and until SPX closes 2 straight months below 21-month MA = GOOD
*If and when SPX closes 2 straight months below 21-month MA = BAD
Summary
So here is what to watch as 2015 winds down and 2016 begins:
*If the trend-following indicators remain bullish and the major average breakout to the upside, then the bull market lives on.
*If the stock market fails to breakout to the upside and the trend-following indicators break to the bearish side you absolutely, positively should (again, in my opinion) be prepared to take some form of “defensive action” (raising some cash, hedging with options, etc.).
Um, Happy New Year (?)

