
Warren Buffett likes industrials, not as much as consumer or healthcare stocks, but he owns a few players from the sector. I personally own some good names from the Dividend Champions list and be happy that I have purchased them a few years before.
Today I would like to screen the investment sector by the best performing dividend stocks since the beginning of the year. Below is a detailed view on cheapest results.
The 20 industrial dividend stocks with highest year-to-date performance generated a return between 37.67 percent and 129.11. Small and mid-cap stocks are the performance driver of the year. 13 of the results have a market capitalization below USD 2 billion.
The whole sector is up 13.8 percent over the past six months, the third best value on the capital market. I believe that stocks with a good stock performance are healthy. Capital investors are confident about the future prospects of the company and they like to pay a higher price to participate on the future of the business.
Not all of the best performing stocks are now expensive. 13 of the results have a low forward P/E and 10 are currently recommended to buy.
Luxfer Holdings (LXFR) has a market capitalization of $439.50 million. The company employs 1,449 people, generates revenue of $510.80 million and has a net income of $43.40 million. The firm’s earnings before interest, taxes, depreciation and amortization (EBITDA) amounts to $80.50 million. The EBITDA margin is 15.76 percent (the operating margin is 12.96 percent and the net profit margin 8.50 percent). LXFR is up 37.68 percent this year.
Financial Analysis: The total debt represents 36.37 percent of the company’s assets and the total debt in relation to the equity amounts to 204.48 percent. Due to the financial situation, a return on equity of 66.77 percent was realized. Twelve trailing months earnings per share reached a value of $2.37. Last fiscal year, the company paid no dividends to shareholders. Forward P/E: 8.56.
Market Valuation: Here are the price ratios of the company: The P/E ratio is 7.08, the P/S ratio is 0.89 and the P/B ratio is finally 5.18. The dividend yield amounts to 2.39 percent and the beta ratio is not calculable.
Hardinge (HDNG) has a market capitalization of $187.43 million. The company employs 1,417 people, generates revenue of $334.41 million and has a net income of $17.86 million. The firm’s earnings before interest, taxes, depreciation and amortization (EBITDA) amounts to $28.41 million. The EBITDA margin is 8.50 percent (the operating margin is 6.01 percent and the net profit margin 5.34 percent). HDNG is up 60.85 percent this year.
Financial Analysis: The total debt represents 6.14 percent of the company’s assets and the total debt in relation to the equity amounts to 12.40 percent. Due to the financial situation, a return on equity of 11.50 percent was realized. Twelve trailing months earnings per share reached a value of $1.33. Last fiscal year, the company paid $0.08 in the form of dividends to shareholders. Forward P/E: 9.08.
Market Valuation: Here are the price ratios of the company: The P/E ratio is 11.97, the P/S ratio is 0.56 and the P/B ratio is finally 1.16. The dividend yield amounts to 0.50 percent and the beta ratio has a value of 1.90.
Alliant Techsystems (ATK) has a market capitalization of $2.84 billion. The company employs 14,000 people, generates revenue of $4.362 billion and has a net income of $272.24 million. The firm’s earnings before interest, taxes, depreciation and amortization (EBITDA) amounts to $575.70 million. The EBITDA margin is 13.20 percent (the operating margin is 10.50 percent and the net profit margin 6.24 percent). ATK is up 43.10 percent this year.
Financial Analysis: The total debt represents 24.50 percent of the company’s assets and the total debt in relation to the equity amounts to 71.49 percent. Due to the financial situation, a return on equity of 19.92 percent was realized. Twelve trailing months earnings per share reached a value of $8.33. Last fiscal year, the company paid $0.92 in the form of dividends to shareholders. Forward P/E: 10.88.
Market Valuation: Here are the price ratios of the company: The P/E ratio is 10.56, the P/S ratio is 0.65 and the P/B ratio is finally 1.89. The dividend yield amounts to 1.18 percent and the beta ratio has a value of 0.85.
Coleman Cable (CCIX) has a market capitalization of $373.87 million. The company employs 1,726 people, generates revenue of $914.58 million and has a net income of $23.50 million. The firm’s earnings before interest, taxes, depreciation and amortization (EBITDA) amounts to $89.45 million. The EBITDA margin is 9.78 percent (the operating margin is 6.98 percent and the net profit margin 2.57 percent). CCIX is up 129.11 percent this year.
Financial Analysis: The total debt represents 72.07 percent of the company’s assets and the total debt in relation to the equity amounts to 632.93 percent. Due to the financial situation, a return on equity of 58.71 percent was realized. Twelve trailing months earnings per share reached a value of $1.43. Last fiscal year, the company paid $0.06 in the form of dividends to shareholders. Forward P/E: 10.88.
Market Valuation: Here are the price ratios of the company: The P/E ratio is 14.80, the P/S ratio is 0.40 and the P/B ratio is finally 7.03. The dividend yield amounts to 0.76 percent and the beta ratio has a value of 1.64.
Take a closer look at the full list of the best performing industrial dividend stocks and which of them are really cheap after the big stock price increase. The average P/E ratio amounts to 24.38 and forward P/E ratio is 15.11. The dividend yield has a value of 1.53 percent. Price to book ratio is 3.73 and price to sales ratio 1.29. The operating margin amounts to 9.35 percent and the beta ratio is 1.54. Stocks from the list have an average debt to equity ratio of 0.98.
Here is the full table with some fundamentals (TTM): 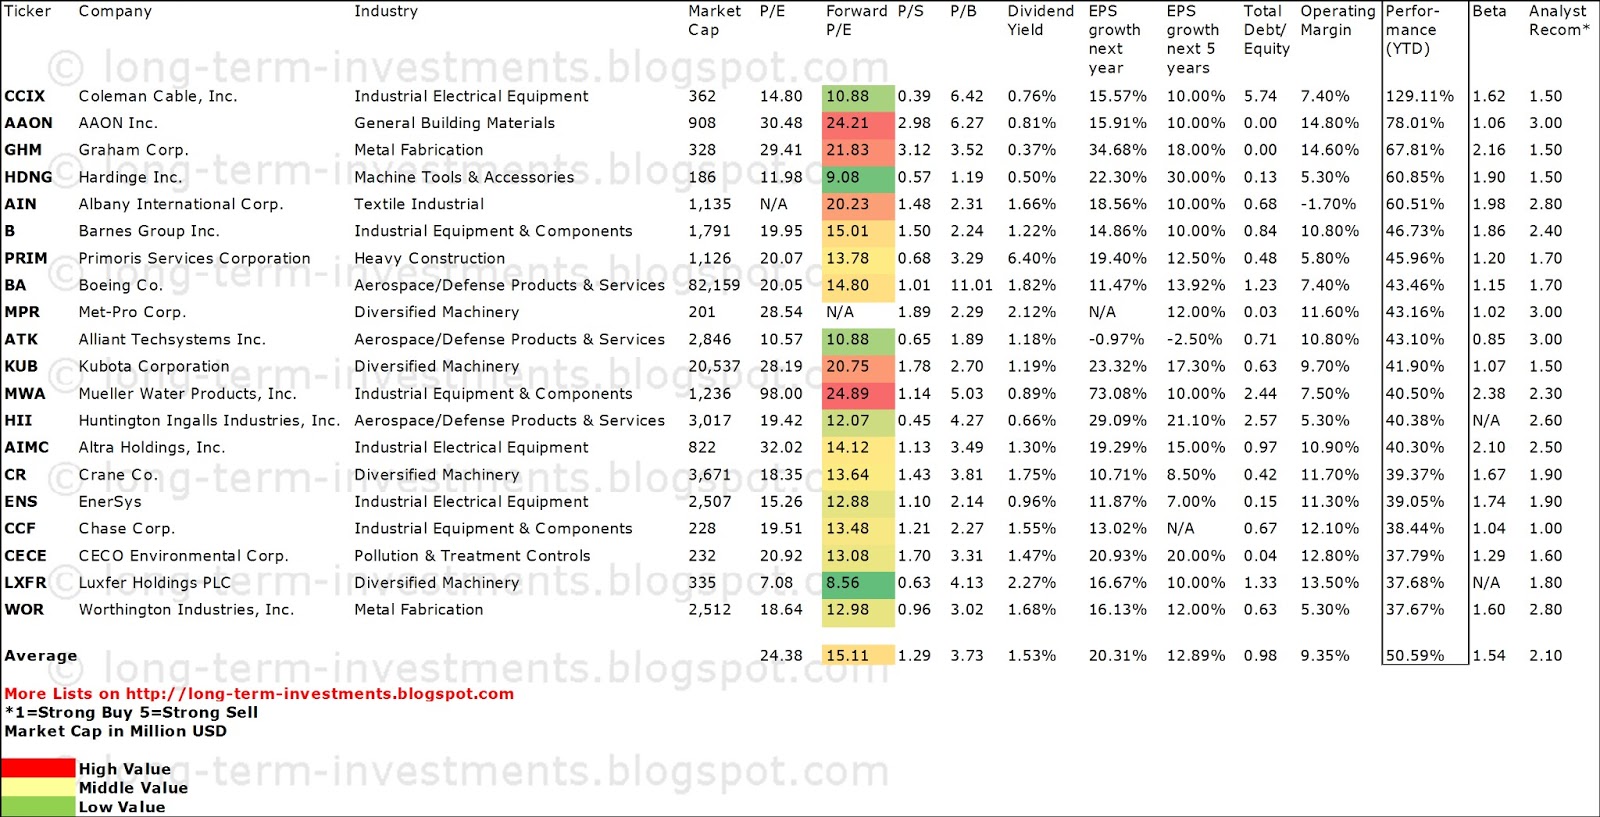
Related stock ticker symbols:
CCIX, AAON, GHM, HDNG, AIN, B, PRIM, BA, MPR, ATK, KUB, MWA, HII, AIMC, CR,
ENS, CCF, CECE, LXFR, WOR
Disclosure: I have no positions in any stocks mentioned, and no plans to initiate any positions within the next 72 hours. I receive no compensation to write about any specific stock, sector or theme.
- English (UK)
- English (India)
- English (Canada)
- English (Australia)
- English (South Africa)
- English (Philippines)
- English (Nigeria)
- Deutsch
- Español (España)
- Español (México)
- Français
- Italiano
- Nederlands
- Português (Portugal)
- Polski
- Português (Brasil)
- Русский
- Türkçe
- العربية
- Ελληνικά
- Svenska
- Suomi
- עברית
- 日本語
- 한국어
- 简体中文
- 繁體中文
- Bahasa Indonesia
- Bahasa Melayu
- ไทย
- Tiếng Việt
- हिंदी
20 Industrial Dividend Stocks With High Performance And Still Cheap
Published 07/12/2013, 03:30 AM
Updated 07/09/2023, 06:31 AM
20 Industrial Dividend Stocks With High Performance And Still Cheap
3rd party Ad. Not an offer or recommendation by Investing.com. See disclosure here or
remove ads
.
Latest comments
Install Our App
Risk Disclosure: Trading in financial instruments and/or cryptocurrencies involves high risks including the risk of losing some, or all, of your investment amount, and may not be suitable for all investors. Prices of cryptocurrencies are extremely volatile and may be affected by external factors such as financial, regulatory or political events. Trading on margin increases the financial risks.
Before deciding to trade in financial instrument or cryptocurrencies you should be fully informed of the risks and costs associated with trading the financial markets, carefully consider your investment objectives, level of experience, and risk appetite, and seek professional advice where needed.
Fusion Media would like to remind you that the data contained in this website is not necessarily real-time nor accurate. The data and prices on the website are not necessarily provided by any market or exchange, but may be provided by market makers, and so prices may not be accurate and may differ from the actual price at any given market, meaning prices are indicative and not appropriate for trading purposes. Fusion Media and any provider of the data contained in this website will not accept liability for any loss or damage as a result of your trading, or your reliance on the information contained within this website.
It is prohibited to use, store, reproduce, display, modify, transmit or distribute the data contained in this website without the explicit prior written permission of Fusion Media and/or the data provider. All intellectual property rights are reserved by the providers and/or the exchange providing the data contained in this website.
Fusion Media may be compensated by the advertisers that appear on the website, based on your interaction with the advertisements or advertisers.
© 2007-2024 - Fusion Media Limited. All Rights Reserved.