Looking for bargains in the high dividend stocks universe? You may want to check out Omega Healthcare Investors Inc (NYSE:OHI), and Medical Properties Trust Inc (NYSE:MPW), 2 Healthcare REIT’s which have lagged the market in 2017, due to the uncertainty surrounding potential healthcare legislation changes in the US.
There may be uncertainty, but let’s remember something – there are 10,000 Baby Boomers retiring every day in the US, which will keep ramping up demand for healthcare facilities for many years to come. In fact, we’ve seen some forecasts which call for Healthcare to eventually reach 20% of GDP in the US.
Profiles: Omega is a REIT, with investments in long term care facilities, (primarily skilled nursing facilities), in the US and the UK, with long-term, triple net lease tenants. Omega has a portfolio of investments that includes over 900 properties located in 42 states and the United Kingdom, operated by 83 different operators.
“Through 2016, Omega ranked 2nd among healthcare REITs with a 247.1% ten-year total shareholder return and was 9th in total shareholder return among all REITs.”
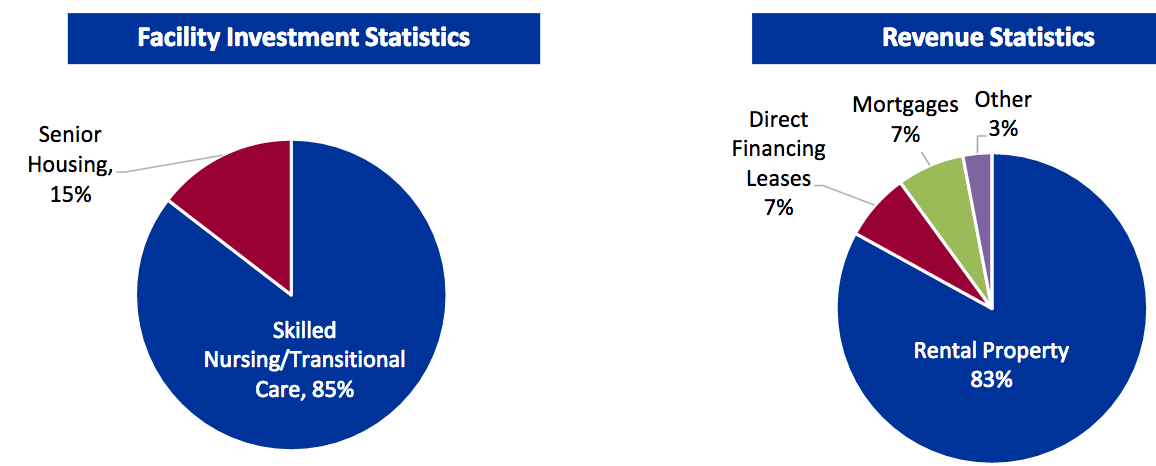
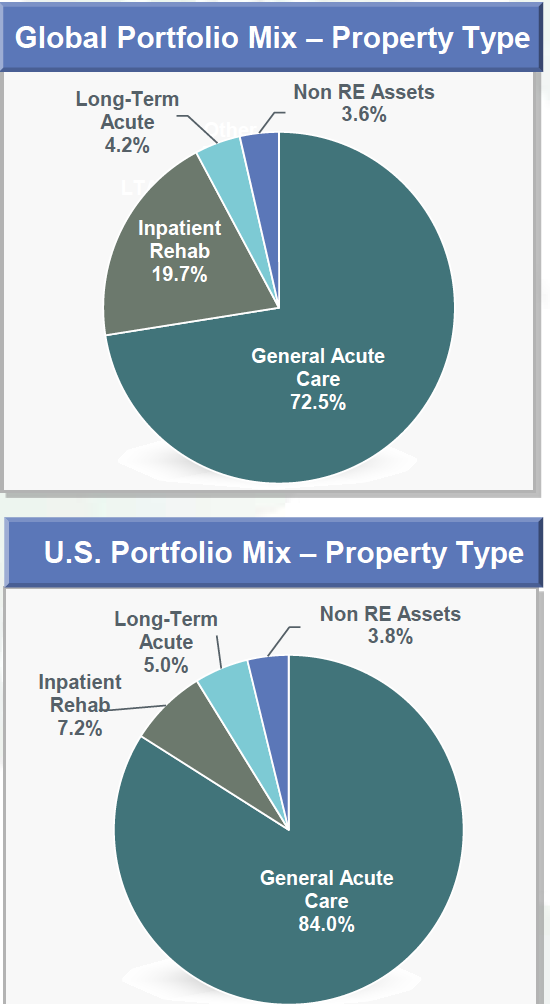
MPW focuses exclusively on providing capital to acute care facilities of all kinds through long-term triple-net leases, in the US, Germany, Spain, and Italy. MPW has managed to grow its assets to more than $6 billion in a little over 10 years. MPW was founded in 2003 and is based in Birmingham, Alabama.
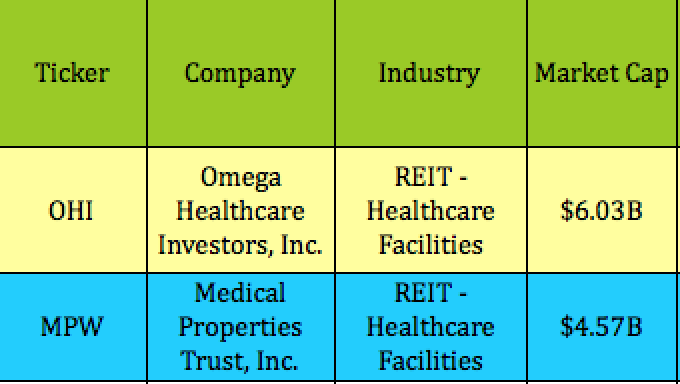
OHI is larger than MPW, with a $6B market cap, vs. $4.57B for MPW.
MPW has had an easier time of it than OHI – it lags the market, but it’s still up 3% in 2017, whereas OHI is down -1.79% in 2017:

Dividends: OHI has had 20 straight quarterly dividend hikes, and has an impressive dividend growth rate of 13.4% over the past 5 years. MPW has had much more modest growth, of just 2.2%, with a $.01 hike in 2016 and 2017.
OHI has a higher dividend yield, at 8.4%, vs. 7.62% for MPW, and also has a lower dividend payout ratio, at 77%, vs. 85% for MPW.
Our High Dividend Stocks By Sectors Tables track both MPW and OHI, (in the Healthcare section).

Options: MPW’s option yields aren’t currently that attractive, but we’ve added this December 2017 covered call trade for OHI to our free Covered Calls Table, where you can see more details for this and over 25 other call-selling trades.

The December $31.00 call strike for OHI pays $1.40, over 2x the amount of its $.64 quarterly dividend, which goes ex-dividend near the end of October. If your shares don’t get assigned, your nominal yield would be 6.65%, based on $2.04 income from the dividend and call option premium, in this approx. 4-month trade, or ~20% annualized.

The December $30.00 put strike pays a bit more, at $1.75, and gives you a $28.25 breakeven, just above OHI’s 52-weel low of $28.11. You can see more details for this and 25 other put-selling trades in our free Cash Secured Puts Table.

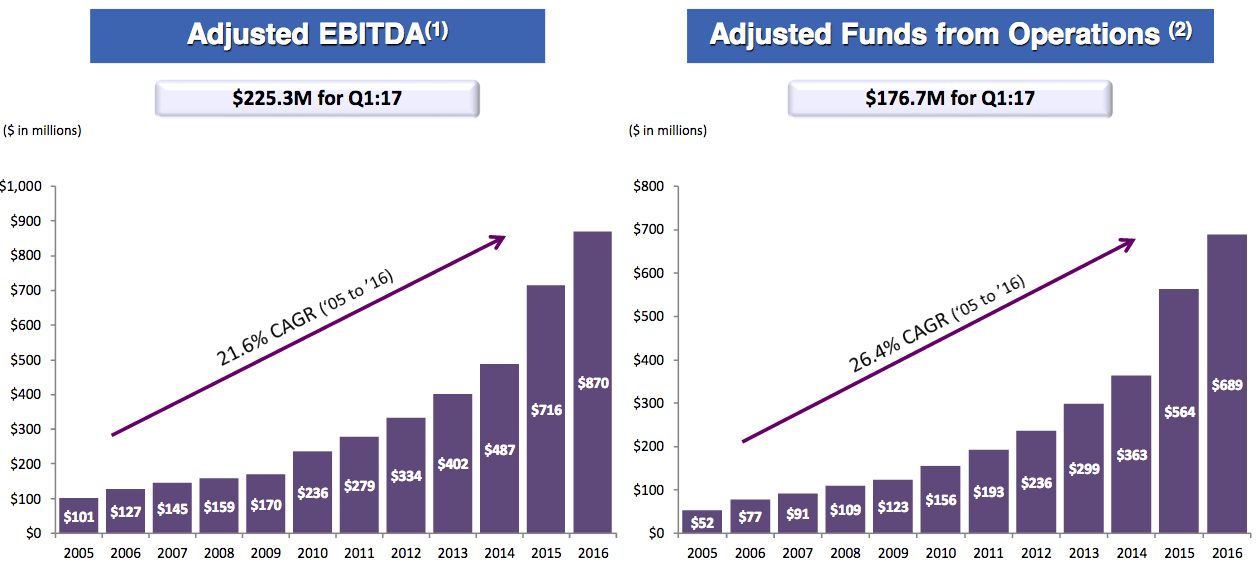
Earnings: OHI has put together some compelling growth rates since 2005 – 21.% CAGR for EBITDA, and 26.4% for AFFO. On the Q2 earnings release, mgt. narrowed its 2017 annual guidance for Adjusted FFO available to common stockholders to be between $3.42 and $3.44 per diluted share, bringing up the bottom of the range from $3.40 to 3.42.
MPW has had big growth over the 1st 2 quarters of 2017 – Net Income was up 26% and FFO grew a whopping 44%. Mgt. is guiding for an FFO/share range of $1.19 – $1.21 for fiscal 2017, which is ~ 19% above its trailing FFO.

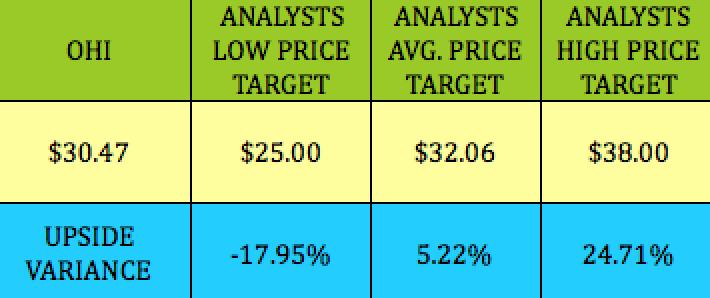
Analysts’ Targets: OHI is ~ 5% below analysts’ consensus price target of $32.06, and 25$ below the high target of $38.00.
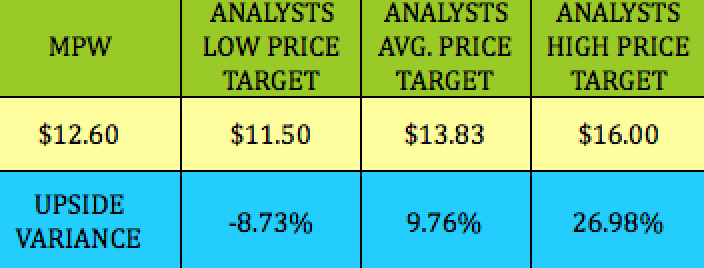
MPW is 9.76% below the consensus price target of $13.83 and 27% below the high target of $16.00:
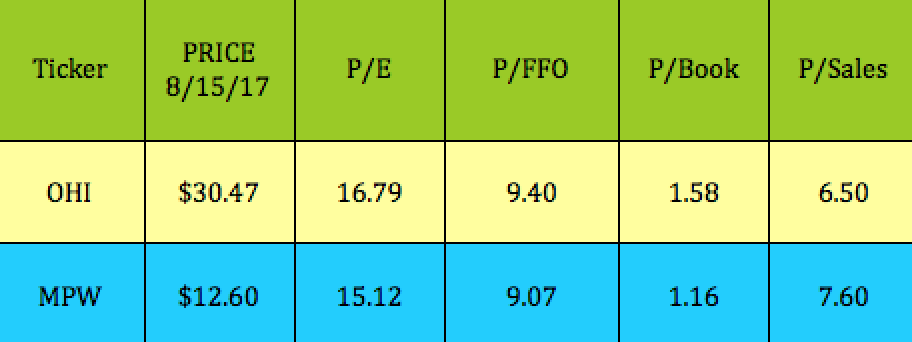
Valuations: Both of these REIT’s have Price/FFO valuations which look cheaper than their peers, on a Price/FFO basis. Healthcare REITs’ Price/FFO are running roughly around 10x all the way up over 22x, vs. 9.4x for OHI, and 9.07x for MPW. MPW also has a cheap Price/Book, nearing parity, at 1.16x:
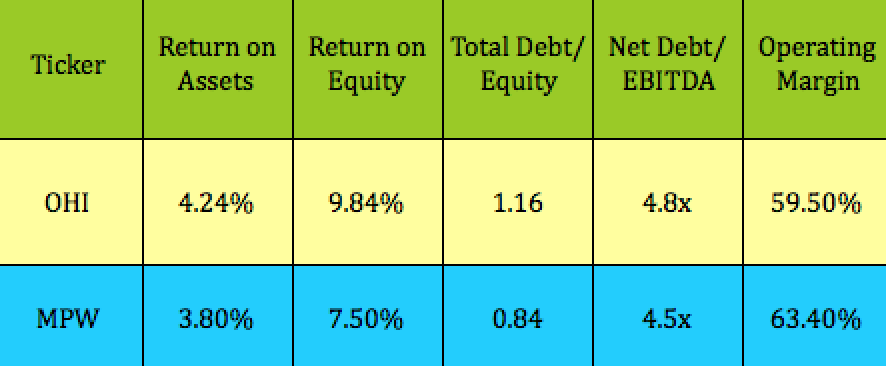
Financials: OHI carries a higher debt load than MPW, but neither one of them has a very heavy debt load for the REIT space, where we often see leverage of well over 5x. THe other metrics are a trade-off – OHI has better ROA and ROE ratios, but a slightly lower Operating Margin.
Disclosure: Author owned shares of OHI at the time of publication.
Disclaimer: This article was written for informational purposes only and is not intended as personal investment advice. Please practice due diligence before investing in any investment vehicle mentioned in this article.
