Square Inc.'s (NYSE:SQ) adjusted loss in the second quarter of 2017 was 4 cents per share, in line with the Zacks Consensus Estimate. Revenues came in at $552 million, surpassing the consensus mark of $536 million. Shares barely moved in afterhours trading.
Year over year, net loss narrowed significantly driven by strong top-line growth, ongoing operating leverage and lower risk loss rates. Strong top-line growth was driven by an increase in larger sellers and product usage through cross-selling.
At the call, management sounded upbeat about the company’s increased focus and progress with automation. Automation is enabling the company to increase reach of financial system to more people, scale up its own operations and help sellers with advanced CRM tools.
The company displays consistent business growth through balancing investment and margin expansion. Square continues to add Invoices sellers, reaping benefits from the integration of Invoices into the Square app. The company continues to expand its industry-specific solutions, thereby increasing the reach of sellers and enhancing sales.
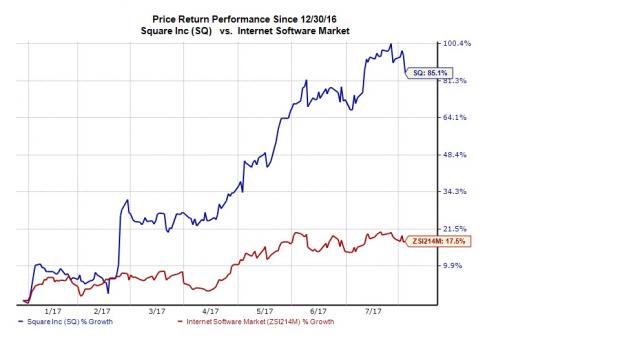
We believe that Square’s comprehensive commerce ecosystem, accelerated business growth and focus on integration, automation, and platform will drive growth going forward. Year to date, Square has impressed investors with its share price surging a massive 85%, significantly outperforming the industry’s rally of 17.5%. An impressive track record of growth backed this rise.

Let’s delve deeper into the numbers.
Revenues
Net revenue was up 19.5% sequentially and 25.8% on a year-over-year basis. Revenues came well ahead of the guided range of $532 million and $538 million.
Square, Inc. Price, Consensus and EPS Surprise
Transaction-based revenues of $482.1 million grew 19.5% sequentially and 32.1% year over year. The rise was driven by strength in Square’s managed payment solutions and point-of-sale offerings.
Subscription and services based revenues of $59.2 million were up 20.6% on a sequential basis and a massive 99% on a year-over-year basis. The increase was driven by significant contributions from Caviar, Square Capital, and Instant Deposit.
Hardware revenues were $10.3 million, up 14.1% sequentially but down 7.2% year over year. The year-over-year decline was the result of higher-than-normal sales associated with pre-orders for contactless and chip reader in the first half of 2016.
Operating Results
Non-GAAP EBITDA margin was 15.2%, up 190 basis points (bps) sequentially but up 790 bps year over year. The year-over-year growth was driven by higher revenues and strong product mix.
Non-GAAP operating expenses of $172.7 million were up 16.4% from $148.3 million in the previous quarter and 28.2% from $134.7 million in the year-ago quarter.
GAAP net loss was almost $16 million or loss of 4 cents per share compared with $15.1 million or loss of 4 cents per share in the previous quarter and $27.3 million or loss of 8 cents per share a year ago.
Balance Sheet and Cash Flow
At the end of the second quarter, cash and cash equivalents balance was $1.1 billion compared with $990 million in the previous quarter. The company has long-term debt of $345.7 million.
Square generated $44 million in cash from operating activities.
Outlook
For the third quarter of 2017, Square expects net revenue between $562 million and $568 million. The Zacks Consensus Estimate is pegged at $562.6 million. Adjusted EBITDA is expected in the range of $27 million to $30 million. Adjusted EPS is expected between 4 cents and 5 cents. The Zacks Consensus Estimate is pegged at a loss of 5 cents.
Zacks Rank and Other Stocks to Consider
Square currently has a Zacks Rank #2 (Buy). Other stocks worth considering in the broader business sector include Alibaba (NYSE:BABA) , Lam Research Corporation (NASDAQ:LRCX) and MaxLinear (NYSE:MXL) , each sporting a Zacks Rank #1 (Strong Buy). You can see the complete list of today’s Zacks #1 Rank stocks here.
Long-term expected earnings per share growth rate for Alibaba, Lam Research and MaxLinear is projected to be 29%, 17.2% and 17.5%, respectively.
Today's Stocks from Zacks' Hottest Strategies
It's hard to believe, even for us at Zacks. But while the market gained +18.8% from 2016 - Q1 2017, our top stock-picking screens have returned +157.0%, +128.0%, +97.8%, +94.7%, and +90.2% respectively.
And this outperformance has not just been a recent phenomenon. Over the years it has been remarkably consistent. From 2000 - Q1 2017, the composite yearly average gain for these strategies has beaten the market more than 11X over. Maybe even more remarkable is the fact that we're willing to share their latest stocks with you without cost or obligation. See Them Free>>
Alibaba Group Holding Limited (BABA): Free Stock Analysis Report
Square, Inc. (SQ): Free Stock Analysis Report
MaxLinear, Inc (MXL): Free Stock Analysis Report
Lam Research Corporation (LRCX): Free Stock Analysis Report
Original post

