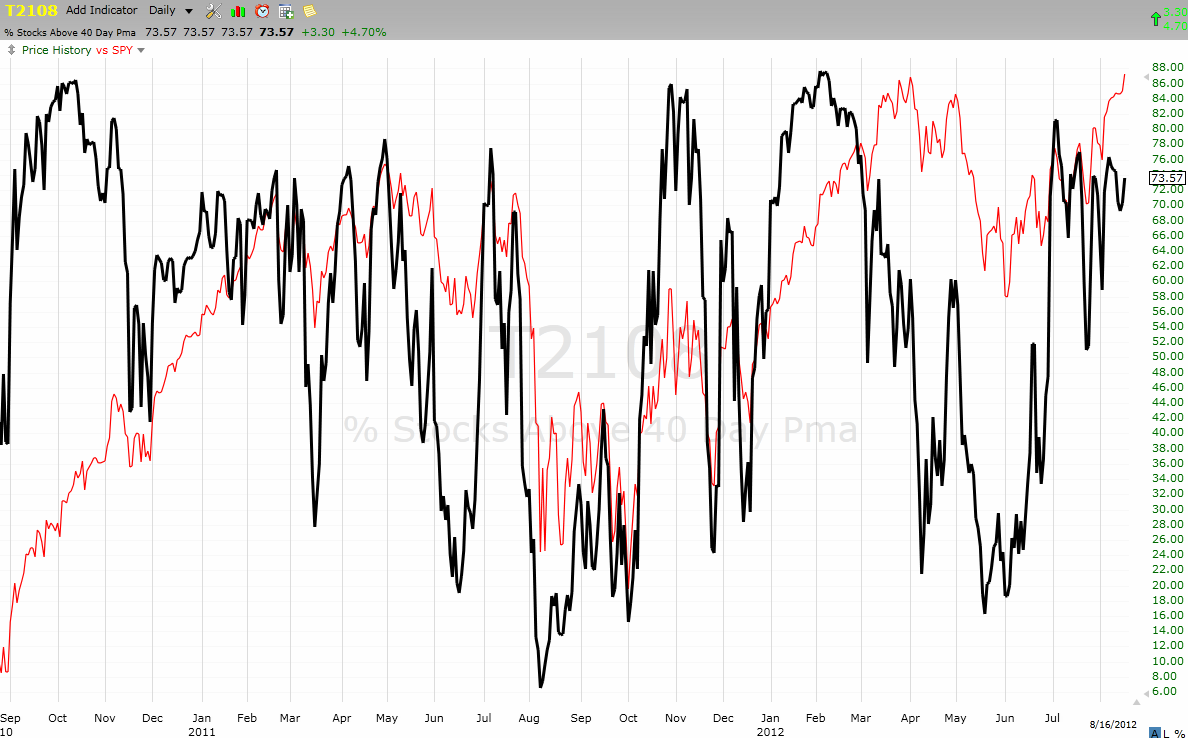
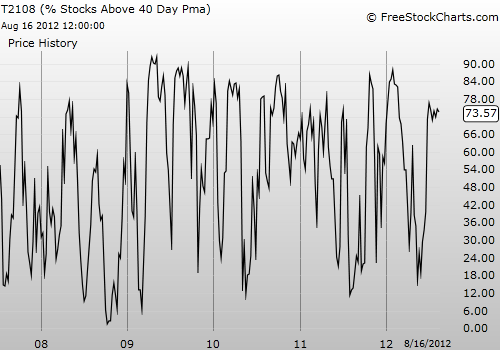
: 73.6% (second day of fifth overbought period since June 29)
VIX Status: 14.3
General (Short-term) Trading Call: Hold.
Commentary
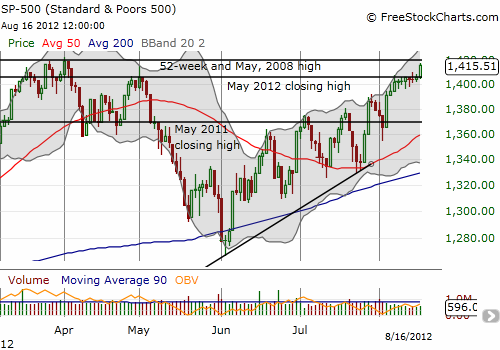
All that pressure that was building up in the previous overbought period finally got released today. As I mentioned earlier, despite the declining volume, the path of least resistance is up and that showed as today’s breakout came on low volume.
&P 500 breaks out to within inches of a new 4+ year high even as volume remains low
T2108 did not leap as far as I would have expected on such a day, only moving 3 percentage points from marginally overbought. I will be looking for T2108 to ramp toward 80% to confirm the strength of any fresh multi-year breakout. Such a rally will need broad participation.
As a reminder, I will switch to an aggressive, “buy-the-dip” strategy only once a breakout is confirmed: first a close to new highs and then follow-through with a higher close. This reduces the odds of getting caught in a headfake. I will switch from buying SSO puts to fade rallies to buying calls on dips (including intraday). This strategy worked well in March. I will also salvage what I can from SDS and transfer that cash to AdvisorShare Active Bear ETF (HDGE) for a long-term backstop for an otherwise bullish bias. I have already dumped my holdings in ProShares UltraShort MSCI Europe (EPV) and bought calls in Siemens Atkins (SI) for good measure!
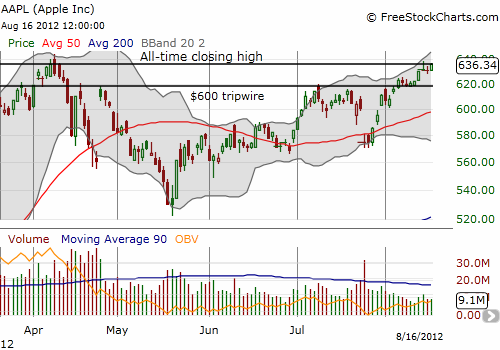
I think on an occasion like this, it is appropriate to roll out a chart of Apple (AAPL). Last week, Apple broke out in convincing fashion. Today, in what I can only call one of those teases you have to see to believe, Apple closed exactly at its all-time closing high. Note that when this high was printed on April 9th, 2012, AAPL opened higher the next day only to close down on the day. That bearish move was the beginning of AAPL’s quick swoon to May lows. You can bet, I, and many other technicians will be following AAPL’s behavior even more closely from here…
Daily T2108 vs the S&P 500
Click chart for extended view with S&P 500 fully scaled vertically (updated at least once a week)

Be careful out there!
Full disclosure: long SDS; long SSO puts; long VXX shares; short VXX calls; long SI calls and puts
- English (UK)
- English (India)
- English (Canada)
- English (Australia)
- English (South Africa)
- English (Philippines)
- English (Nigeria)
- Deutsch
- Español (España)
- Español (México)
- Français
- Italiano
- Nederlands
- Polski
- Português (Portugal)
- Português (Brasil)
- Русский
- Türkçe
- العربية
- Ελληνικά
- Svenska
- Suomi
- עברית
- 日本語
- 한국어
- 简体中文
- 繁體中文
- Bahasa Indonesia
- Bahasa Melayu
- ไทย
- Tiếng Việt
- हिंदी
Pressure Released Into A Breakout, Apple On The Edge
Published 08/17/2012, 01:37 AM
Updated 07/09/2023, 06:31 AM
Pressure Released Into A Breakout, Apple On The Edge
T2108 Status
Latest comments
Loading next article…
Install Our App
Risk Disclosure: Trading in financial instruments and/or cryptocurrencies involves high risks including the risk of losing some, or all, of your investment amount, and may not be suitable for all investors. Prices of cryptocurrencies are extremely volatile and may be affected by external factors such as financial, regulatory or political events. Trading on margin increases the financial risks.
Before deciding to trade in financial instrument or cryptocurrencies you should be fully informed of the risks and costs associated with trading the financial markets, carefully consider your investment objectives, level of experience, and risk appetite, and seek professional advice where needed.
Fusion Media would like to remind you that the data contained in this website is not necessarily real-time nor accurate. The data and prices on the website are not necessarily provided by any market or exchange, but may be provided by market makers, and so prices may not be accurate and may differ from the actual price at any given market, meaning prices are indicative and not appropriate for trading purposes. Fusion Media and any provider of the data contained in this website will not accept liability for any loss or damage as a result of your trading, or your reliance on the information contained within this website.
It is prohibited to use, store, reproduce, display, modify, transmit or distribute the data contained in this website without the explicit prior written permission of Fusion Media and/or the data provider. All intellectual property rights are reserved by the providers and/or the exchange providing the data contained in this website.
Fusion Media may be compensated by the advertisers that appear on the website, based on your interaction with the advertisements or advertisers.
© 2007-2024 - Fusion Media Limited. All Rights Reserved.
