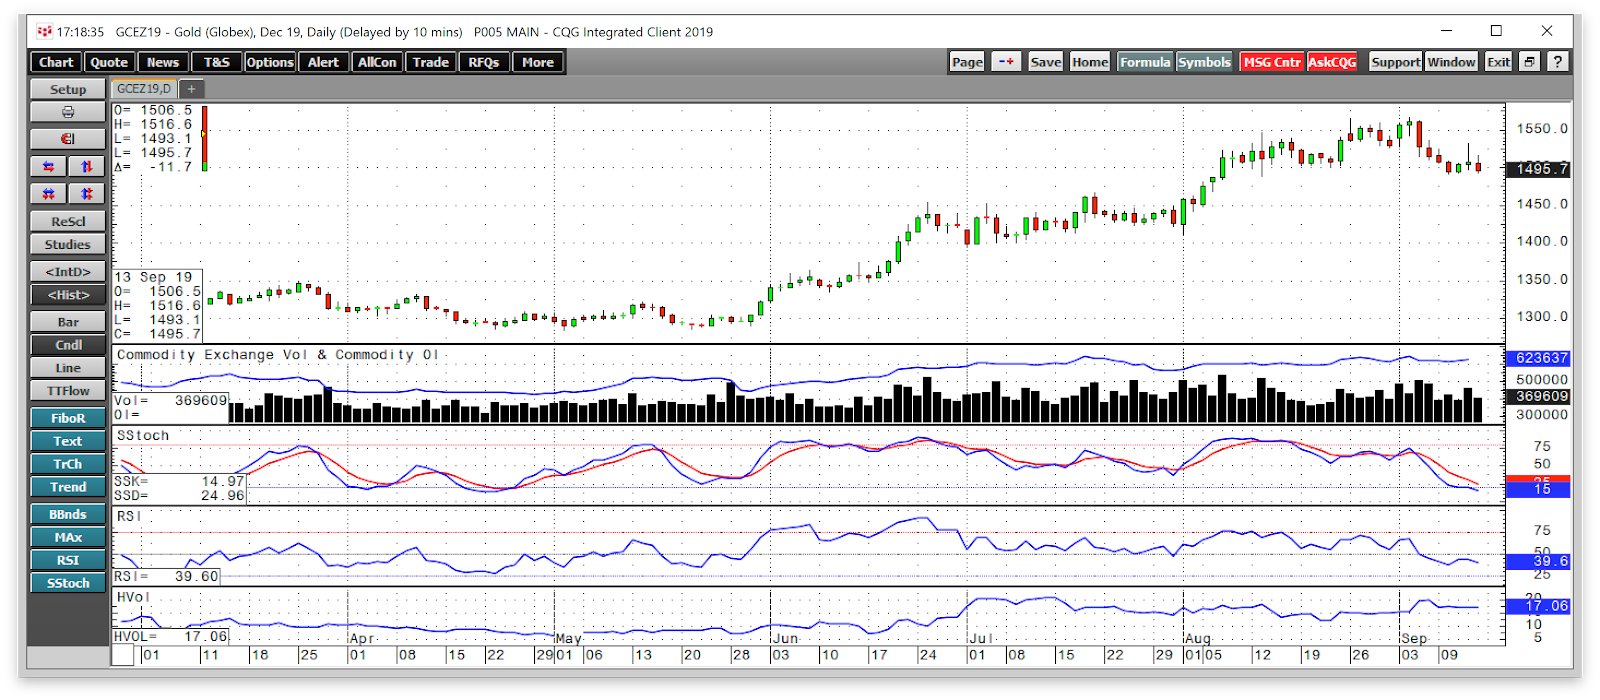
Gravity hit the gold market over recent sessions. After rising to a high $1566.20 on the COMEX December futures contract on September 4, the price pulled back to the $1500 level. December gold futures closed on Friday, September 13 at $1507 per ounce.
After the rally from under $1300 in May to the highest price since 2013, a pullback is healthy for the gold market. It is always a challenge to pinpoint highs or lows when a market is moving. Meanwhile, all signs continue to point to a higher low during the current corrective period and a resumption of the next leg of the bull market in the yellow metal before too long.
Gold took off on the upside back in June when the US Federal Reserve told the market that short-term interest rates would move lower by the end of 2019. On July 31, the end of quantitative tightening and a 25-basis point cut in the Fed Funds rate propelled the price of the precious metal to a higher high. Last week, we heard from another leading central bank, and its message was also bullish and provided a reason to buy the current dip in the yellow metal. The SPDR Gold Shares (NYSE:GLD) is the most liquid ETF product that tracks the price of gold.
Gold dips below $1500
After the bearish key reversal trading pattern on the weekly chart during the week of September 3, gold continued to correct to the downside last week.

As the daily chart highlights, gold settled the week at $1499.50 on the active month December futures contract and moved lower in the aftermarket on Friday, September 13. Open interest held steady at over 620,000 contracts during the recent selloff. Price momentum and relative strength indicators moved from overbought conditions to oversold territory as the price of the precious metal has declined by around $70 per ounce since the September 4 peak. Daily historical volatility has held steady at the 17% level as the daily trading ranges continue to be wide.
The bearish calls rise- The ECB provides a reason to buy the dip
Over the past two weeks, gold went from the front to the back pages when it comes to the business news. Everyone loves a bull market. While gold was rising from June through the beginning of this month, gold was one of the best-performing assets across all asset classes. Meanwhile, the retreat has caused more than a few technical analysts to come out of the woodwork calling for a significant decline because of the overbought condition and an extreme in the number of speculative longs in the yellow metal.
Meanwhile, the news from the European Central Bank last week was another reason to carefully buy gold on a scale down basis during the present correction. The ECB cut its short-term deposit rate by ten basis points to negative 50 basis points. Moreover, starting in November, the ECB will begin to purchase 20 billion euros of debt to stimulate the European economy. The move was another in a long series of accommodative monetary policy moves by the ECB, and it puts pressure on the US Fed when the FOMC meets this week. The Fed will announce its decision on rates on Wednesday, September 18 and the odds favor another 25 basis point rate cut in the Fed Funds rate.
Lower interest rates in the US and around the world lit the bullish fuse under the gold market and a continuation of dovish monetary policy us likely to keep it burning.
In a bull market, it is crucial for bearish to fuel the trajectory of prices
Bull markets tend to suffer periods of correction where prices fall to levels where it looks like the bull is shifting into bearish mode. The most dramatic example came in 2008 when gold rose to a high at $1033.90 in March, which was a new record high. The global financial crisis sent the price down to a low at $681 seven months late in October 2008. Gold was back above the $1000 level four months later in February 2009, on its way to its record peak at $1920.70 on 2011.
During the current correction, I would like to see the open interest metric to drop to further cleanse some of the weaker speculative longs out of the market. This week, all eyes will be on the US central bank for its next move on interest rates. A continuation of falling rates and accommodative monetary policy will keep me bullish on the price of the yellow metal.
The SPDR® Gold Shares (NYSE:GLD) was trading at $142.25 per share on Wednesday morning, up $0.65 (+0.46%). Year-to-date, GLD has gained 15.04%, versus a 12.95% rise in the benchmark S&P 500 index during the same period.
GLD (NYSE:GLD) currently has an ETF Daily News SMART Grade of B (Buy), and is ranked #1 of 33 ETFs in the Precious Metals ETFs category.
