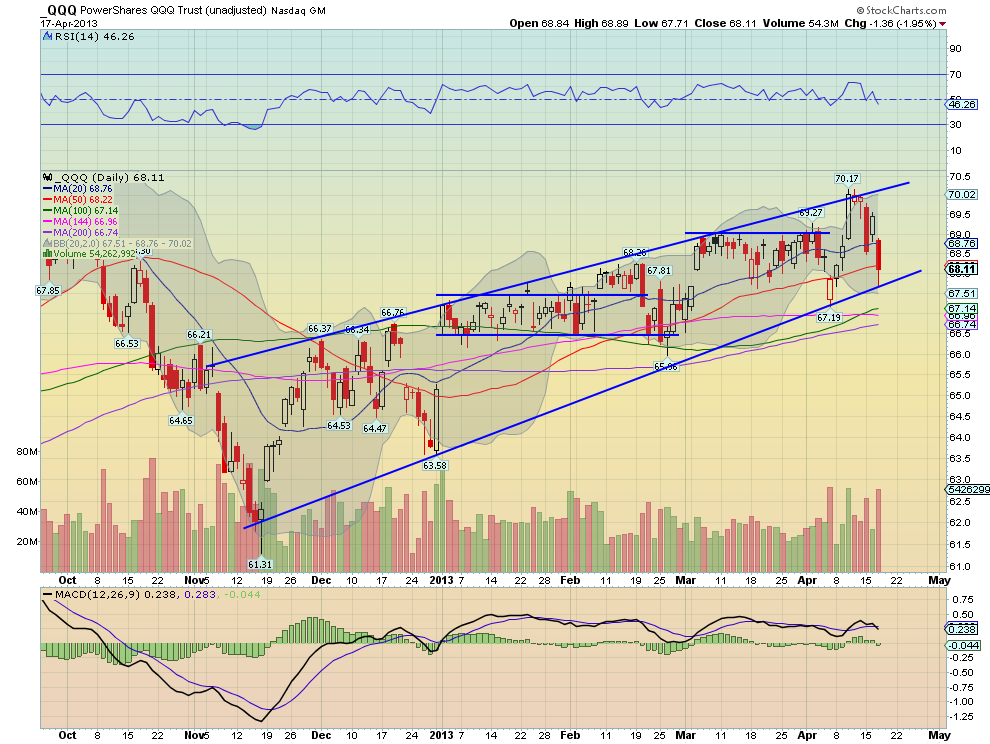
The Nasdaq, represented by the QQQ, has been seen as the laggard during the market's rise through March. And rightly so as the Russell 2000 barreled ahead with the S&P 500 not far behind. The QQQ was the slow plodder higher. From the daily chart below you can see the rising channel that began at the November lows. With Wednesday’s action, touching the bottom rail and then retreating back up to the rising 50-day simple moving average (SMA), it's not time, yet, to throw in the towel on a continued move higher.
Hold On
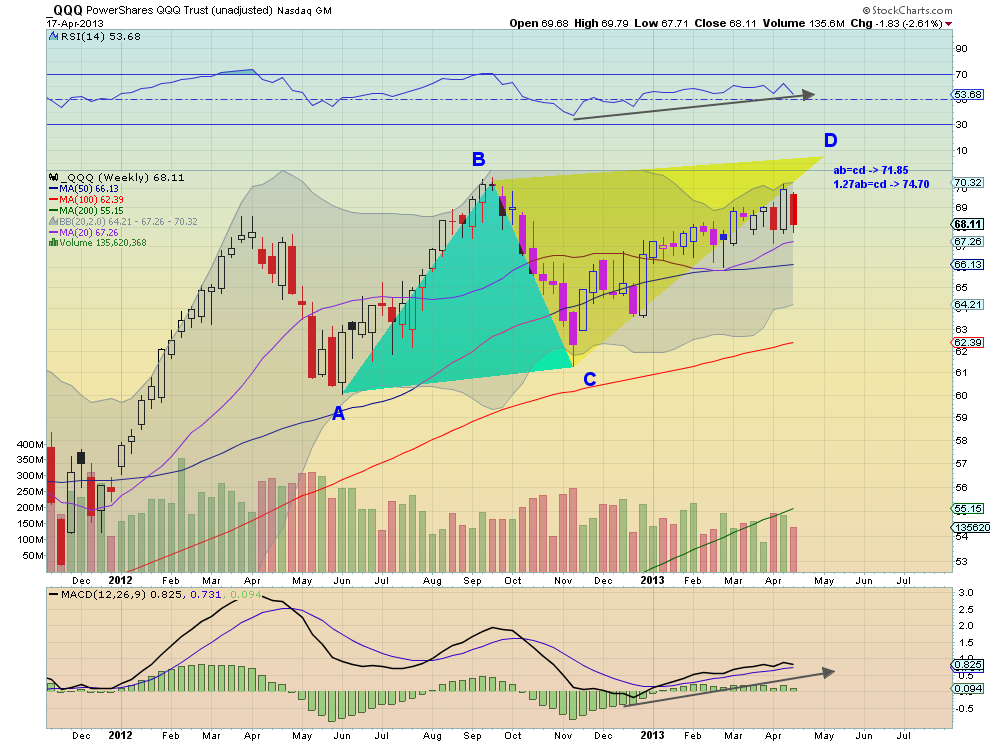
The weekly chart gives more reason to hold. The RSI is trending higher, the MACD is trending higher on the signal line and the price is trending higher-and-above the SMA’s. Additionally, it's working on an ABCD pattern that completes at 71.85 or 74.70 if it turns out to be a 1.27AB extension. I like the latter as it is also very close to the three-box reversal Point and Figure price objective of 76. If price does reverse and negate these signals, I'm out. But it's not time yet.
The information in this blog post represents my own opinions and does not contain a recommendation for any particular security or investment. I or my affiliates may hold positions or other interests in securities mentioned in the Blog, please see my Disclaimer page for my full disclaimer.
Original post
- English (UK)
- English (India)
- English (Canada)
- English (Australia)
- English (South Africa)
- English (Philippines)
- English (Nigeria)
- Deutsch
- Español (España)
- Español (México)
- Français
- Italiano
- Nederlands
- Português (Portugal)
- Polski
- Português (Brasil)
- Русский
- Türkçe
- العربية
- Ελληνικά
- Svenska
- Suomi
- עברית
- 日本語
- 한국어
- 简体中文
- 繁體中文
- Bahasa Indonesia
- Bahasa Melayu
- ไทย
- Tiếng Việt
- हिंदी
Don’t Give Up On The Nasdaq Just Yet
Published 04/18/2013, 10:45 AM
Updated 05/14/2017, 06:45 AM
Don’t Give Up On The Nasdaq Just Yet
Latest comments
Loading next article…
Install Our App
Risk Disclosure: Trading in financial instruments and/or cryptocurrencies involves high risks including the risk of losing some, or all, of your investment amount, and may not be suitable for all investors. Prices of cryptocurrencies are extremely volatile and may be affected by external factors such as financial, regulatory or political events. Trading on margin increases the financial risks.
Before deciding to trade in financial instrument or cryptocurrencies you should be fully informed of the risks and costs associated with trading the financial markets, carefully consider your investment objectives, level of experience, and risk appetite, and seek professional advice where needed.
Fusion Media would like to remind you that the data contained in this website is not necessarily real-time nor accurate. The data and prices on the website are not necessarily provided by any market or exchange, but may be provided by market makers, and so prices may not be accurate and may differ from the actual price at any given market, meaning prices are indicative and not appropriate for trading purposes. Fusion Media and any provider of the data contained in this website will not accept liability for any loss or damage as a result of your trading, or your reliance on the information contained within this website.
It is prohibited to use, store, reproduce, display, modify, transmit or distribute the data contained in this website without the explicit prior written permission of Fusion Media and/or the data provider. All intellectual property rights are reserved by the providers and/or the exchange providing the data contained in this website.
Fusion Media may be compensated by the advertisers that appear on the website, based on your interaction with the advertisements or advertisers.
© 2007-2024 - Fusion Media Limited. All Rights Reserved.
