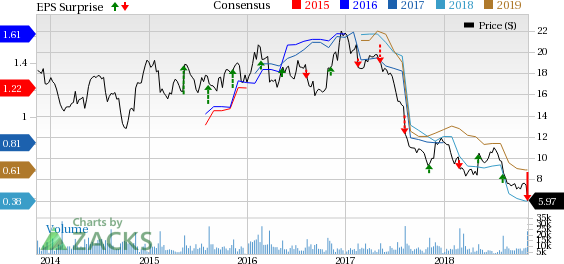
Dean Foods Company’s (NYSE:DF) third-quarter 2018 results were quite a disappointment, with the company’s reported loss being wider than the Zacks Consensus Estimate. Both the top and bottom lines deteriorated year over year owing to plant closures and associated transitionary expenses. Further, escalated fuel, freight, resin costs as well as volatility surrounding fluid milk volumes marred the quarterly performance. Reflective of this, management lowered the outlook for 2018.
These also dampened investor sentiments as the company saw its shares crash 22.1% on Nov 7, when it released third-quarter outcome. In fact, the slump took the company’s three-month stock performance to a decline of 29.9%, while the industry fell 28.3%.
.jpg)
Q3 in Detail
Adjusted loss of 28 cents per share was wider than the Zacks Consensus Estimate of a loss of 6 cents. The bottom line compared unfavorably with earnings of 20 cents in the year-ago quarter. This was mainly driven by volume loss stemming from the closure of seven plants in the quarter and the associated transition costs.
Continued decline in fluid milk consumption and inflationary trends across fuel, resin and freight costs were a few deterrents during the quarter. A tight labor market also affected performance. In fact, raw milk costs ticked up 1% on a sequential basis but declined 11% year over year.
Net sales declined 2.2% to $1,894 million but surpassed the Zacks Consensus Estimate of $1,835 million. Volumes in the quarter declined significantly year over year although it was in line with the company’s expectations. Further, per USDA results, fluid milk category dropped 2% through August on a quarter-to-date basis.
Dean Foods Company Price, Consensus and EPS Surprise
Adjusted gross profit declined almost 13% to $390 million, with adjusted gross margin contracting 250 basis points to roughly 20.6%. Adjusted operating loss was $20 million in the quarter against adjusted operating income of $47 million a year ago.
Financial Position
Dean Foods ended the quarter with cash and cash equivalents of $21.8 million, long-term debt (including current portion) of approximately $887 million and shareholders’ equity of $584.3 million. Total debt outstanding, excluding cash in hand, was nearly $870 million as of Sep 30, 2018.
In the first nine months of 2018, the company generated nearly $119.8 million of net cash from operating activities and $51 million of free cash flow from continuing operations. Capital expenditures during the same period amounted to nearly $69 million.
At the end of the third quarter, Dean Foods’ net debt to bank EBITDA total leverage ratio on an all-cash-netted basis was 3.60 times.
Outlook
Though plant closures severely affected the third-quarter results, management expects such actions to re-scale supply chain to prove lucrative. Further, the company is working toward minimizing the negative impacts stemming from rising costs. However, the company doesn’t expect any respite from such headwinds anytime soon. That said, Dean Foods lowered its outlook for 2018.
The company now envisions 2018 bottom line to range between a loss of 10 and 30 cents per share, compared with the previous view of earnings in the band of 32-52 cents. Also, the company slashed the cash flow outlook and expects the same to range between $30 and $50 million, compared with the previous range of $40-$60 million. Capital spending is now expected in the band of $100-$120 million compared with $125-$150 million guided earlier.
This Zacks Rank #3 (Hold) company expects the ongoing cost productivity plan to yield favorably in 2019. Further, the company expects efforts related to augmenting brand strength, improving technology and infrastructural capabilities to aid business growth.
Greedy for Consumer Staples Stocks? Check These
The Chefs' Warehouse, Inc (NASDAQ:CHEF) , with long-term EPS growth rate of 19%, flaunts a Zacks Rank #1 (Strong Buy). You can see the complete list of today’s Zacks #1 Rank stocks here.
McCormick & Company, Incorporated (NYSE:MKC) has long-term EPS growth rate of 9% and a Zacks Rank #2 (Buy).
Ollie’s Bargain Outlet (NASDAQ:OLLI) , a Zacks Rank #2 stock, has surpassed estimates in the past four quarters.
The Hottest Tech Mega-Trend of All
Last year, it generated $8 billion in global revenues. By 2020, it's predicted to blast through the roof to $47 billion. Famed investor Mark Cuban says it will produce "the world's first trillionaires," but that should still leave plenty of money for regular investors who make the right trades early.
See Zacks' 3 Best Stocks to Play This Trend >>
Ollie's Bargain Outlet Holdings, Inc. (OLLI): Free Stock Analysis Report
Dean Foods Company (DF): Free Stock Analysis Report
McCormick & Company, Incorporated (MKC): Free Stock Analysis Report
The Chefs' Warehouse, Inc. (CHEF): Free Stock Analysis Report
Original post

