AstraZeneca plc (NYSE:AZN) beat the Zacks Consensus Estimate for both earnings and sales in the first quarter of 2018. The company’s top line was driven by new drugs and emerging markets. However, the stock fell 1.4% in pre-market trading on Apr 26.
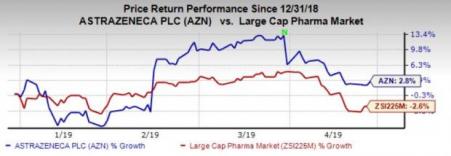
This year so far, AstraZeneca’s shares have increased 2.8% against its industry’s decrease of 2.6%.

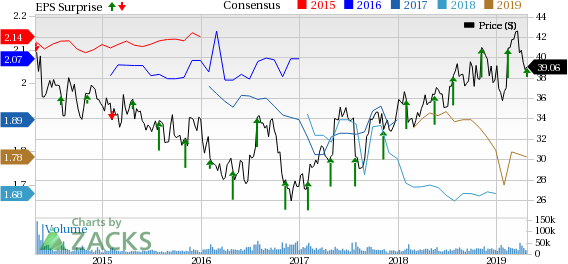
First-quarter 2018 core earnings of 45 cents per American Depositary Share (“ADS”) beat the Zacks Consensus Estimate of 43 cents. Core earnings per share of 89 cents increased 100% year over year at constant exchange rates (“CER”), benefiting from higher revenues and operating profit.
Total revenues were up 11% at CER to $5.5 billion in the reported quarter. Revenues also beat the Zacks Consensus Estimate of $5.27 billion.
All growth rates mentioned below are on a year-over-year basis and at CER.
Product Sales Rise
Product sales rose 14% at CER in the quarter to $5.47 billion. Higher sales of newer medicines, particularly cancer drugs, and strong performance in emerging markets, mainly China, offset lower sales of many other legacy medicines and drove product sales growth.
Collaboration revenues (formerly Externalization revenues) were down 86% from the year-ago period to $26 million.
Among AstraZeneca’s various therapeutic areas, Oncology was up 59%, New Cardiovascular, Renal and Metabolism (“CVRM”) was up 19% and Respiratory rose 14%. However, other medicines declined 21%.
Newer Products
Among the newer medicines, Lynparza sales rose 13.4% sequentially to $237 million in the quarter on the back growth in all regions. AstraZeneca markets Lynparza in partnership with Merck (NYSE:MRK) . U.S. sales of the drug increased 80%, following its approval in first-line maintenance treatment for BRCA-mutated ovarian cancer in late 2018.
Tagrisso recorded sales of $630 million, up 92% year over year, driven by rapid uptake in the first-line setting. Tagrisso was approved in the first-line setting for advanced lung cancer in the United States in April, in EU in June and in Japan in August. The drug was also established as the standard of care for first-line lung cancer last year. Sales in second-line setting drove sales in emerging markets, which more than doubled.
Imfinzi generated sales of $295 million in the quarter, up 12.6% compared to the fourth quarter of 2018. Sales were mainly driven by strong demand in last-stage lung cancer patients.
Calquence, which was launched in the United States in October 2017, generated sales of $29 million in the first quarter compared with $24 million in the previous quarter.
Brilinta/Brilique sales were $348 million in the reported quarter, up 24% year over year.
Farxiga recorded sales of $349 million in the quarter, up 23% year over year mainly driven by growth in emerging markets and Japan.
New asthma medicine, Fasenra recorded sales of $129 million in the quarter compared with $125 million in the previous quarter. AstraZeneca said Fasenra enjoy leadership position among novel biologic asthma medicines.
Bevespi, a LAMA/LABA in a pressurized metered dose inhaler, recorded sales of $10 million in the quarter, similar to the previous quarter, amid slower-than-anticipated growth in LAMA/LABA class.
Among other medicines, Iressa sales gained 7% to $134 million. Bydureon sales increased 4% to $142 million and Onglyza sales gained 23% to $153 million. However, Byetta sales were flat at $30 million and Movantik/Moventig recorded sales of $25 million in the quarter, down 11%.
Older Products
Crestor sales declined 9% to $335 million. U.S. and Europe sales were weak as multiple generic versions of the drug entered the market.
Symbicort sales declined 3% in the quarter to $585 million due to pricing pressure in the United States and stiff competition in Europe. Pulmicort sales rose 16% to $383 million as higher sales in the emerging markets made up for weaker performance in the United States and Europe.
Nexium recorded sales of $363 million, down 16% due to lower sales in the United States and Europe. Sales of other legacy drugs including Faslodex, Zoladex, Seloken and Daliresp/Daxas grew in the quarter while sales of others like Synagis, Casodex and Atacand declined.
In late 2018, AstraZeneca announced its decision to divest prescription medicine rights to Nexium in Europe and U.S. rights to Synagis.
Regional Performance
In the United States, product sales were up 20% to $1.8 billion on the back of higher sales of newer products. However, European markets witnessed a 6% decline in sales to $982 million. Revenues from Emerging Markets were up 22% to $2 billion, primarily on the back of strong growth in China (up 28% to $1.2billion). In Established ROW market (comprising Japan, Canada and other markets), sales were up 16% to $693 million.
Profit Discussion
AstraZeneca’s core gross margin increased two percentage points to 80.5%. Core selling, general and administrative (SG&A) expenses rose 6% to $2.1 billion.
In the quarter, core research and development (R&D) expenses rose 3% to $1.23 billion. Operating margin increased 13 percentage points to 30% in the quarter due to higher revenues and gross margin.
2019 Outlook
AstraZeneca maintained its earnings and sales outlook for 2019.
AstraZeneca expects core earnings for 2019 in the range of $1.75 to $1.85 per ADS. The Zacks Consensus Estimate is pegged at $1.78. The company expects product sales to grow in high-single digit percentage.
Currency movements are expected to unfavorably impact product sales and core earnings per share by a low single-digit percentage.
Adjusted tax rate is expected to be in the range of 18%-22%.
Zacks Rank & Stocks to Consider
AstraZeneca currently carries a Zacks Rank #3 (Hold). Two better-ranked stocks in the healthcare sector are Celsion Corporation (NASDAQ:CLSN) and Eli Lilly and Company (NYSE:LLY) . While Celsion sports a Zacks Rank #1 (Strong Buy), Lilly carries a Zacks Rank #2 (Buy). You can see the complete list of today’s Zacks #1 Rank (Strong Buy) stocks here.
Celsion’s loss estimates have narrowed from 94 cents to 78 cents for 2019 and 2020 over the past 60 days.
Lilly’s earnings per share estimates have moved upward from $5.60 to $5.66 for 2019 and $6.42 to $6.63 for 2020 over the past 60 days.
Zacks' Top 10 Stocks for 2019
In addition to the stocks discussed above, would you like to know about our 10 finest buy-and-holds for the year?
Who wouldn't? Our annual Top 10s have beaten the market with amazing regularity. In 2018, while the market dropped -5.2%, the portfolio scored well into double-digits overall with individual stocks rising as high as +61.5%. And from 2012-2017, while the market boomed +126.3, Zacks' Top 10s reached an even more sensational +181.9%.
AstraZeneca PLC (AZN): Free Stock Analysis Report
Merck & Co., Inc. (MRK): Free Stock Analysis Report
Eli Lilly and Company (LLY): Free Stock Analysis Report
Celsion Corporation (CLSN): Free Stock Analysis Report
Original post
Zacks Investment Research

