Technical Analysis is the systematic evaluation of price, volume, breadth and open interest, for price forecasting. The premise is that prices follow certain patterns and therefore could be predicted.
In a previous article , we discussed the momentum indicator and Moving Averages (MA) measures, in particular. We mentioned that technical analysis indicators are more effective when used in combination – i.e., understanding the combined implication of a few indicators, rather than focusing, solely, on one specific indicator. We will discuss how indicators can be combined and interpreted (with an example) below.
In this article, we introduce the Fibonacci Retracement indicator. It is a very popular tool used by many technical traders to help identify strategic places for transactions to be placed, target prices, or stop losses.
Before we delve into Fibonacci calculations and its uses, we should understand its meaning first, and prove its existence in human behavior – which is the reason why any crypto trader must have it in his/her trading arsenal.
What is Fibonacci and why should you care?
The natural tendency of collective human decision-making follows a unique pattern that reiterates by the ratio of 61.8%. This ratio, often referred to as the “Golden Mean” derived from the Fibonacci number sequence.
The twelfth century monk and mathematician Leonardo de Pisa (later branded as Fibonacci) uncovered a logical sequence of numbers that appears throughout nature and in great works of art. The sequence begins with the numbers 0 and 1 and then each number that is the sum of the preceding two: 0, 1, 1, 2, 3, 5, 8, 13, 21, 34, 55, 89, 144, 233, 377, 610, and so on. There is a mathematical property that makes this sequence remarkable. Dividing each successive number by the preceding one gives a quotient progressing toward a constant that roughly equals to 1.618 or “phi”. Called the Golden Ratio, this value approaches 1.618 as it gets larger. An unusual quality that has drawn attention is that the inverse equals 0.618.
Why is inverse ratio so appealing?
Most of the natural shapes begins with spiral pattern and eventually grow out based on a logarithmic function. The Fibonacci sequence is a log-periodic series and is found frequently in the geometry of nature – such as spiral shells in seashells, florets, animal skin, the human body, our DNA structure and even in the cosmos and planetary systems.
More interesting, however, is the Golden Ratio’s relation to human behavior. No matter how intelligent we are individually, our collective behavior is governed by the Limbic system of our brains. Our rational thinking and reasoning become obscured by intense emotional attributes such as insecurity, fear, pleasure, desire and many other evolutionary traits. In pursuit of a collective goal, we are often motivated to act irrationally and tend to behave in an impulsive manner. This is distinctive of a coordinated behavior called Crowd Effect or Herding.
Scientists have performed numerous experiments, in different groups of objects, and have successfully observed herding patterns in the outcome. When humans were asked to choose between different value-neutral choices in a real or simulated environments, the frequency distribution of those responses are being found to be biased by 62/38. While we would think that in a neutral environment the outcome should be more like 50/50, the results of those experiments suggest otherwise.
The 62/38 bias nicely reflects the Fibonacci Golden Ratio. 62 is roughly the rounding of 0.618 and 38 is roughly 1 – 0.618 = 0.382. It is truly amazing how human behavior fits into the Fibonacci rules and is observed in global financial markets. Traders are becoming more and more aware of the facts that financial markets, on average, advance by 100% and retrace 61.8%, both in price and time.
Legendary analysts such as Robert Rhea and R.N Elliott (who developed the Elliott Wave Theory, which will be discussed in a future article) have examined the statistical correlation of price and time in market cycles. Their findings uncovered substantial evidence of Fibonacci-structured market behavior, and their trading strategies are based on these findings.
What is Fibonacci Retracement?
Fibonacci retracement is a term used in technical analysis, which refers to areas of support (i.e., prices stop going lower) or resistance (i.e., prices stop going higher). The Fibonacci levels used are – 23.6% (approximately a number in the Fibonacci sequence divided by another three places higher), 38.2% (approximately a number in the Fibonacci sequence divided by another two places higher), 50%, 61.8% (the Golden Ratio) and 100%.
Fibonacci retracement levels are static prices that do not change, unlike Moving Averages (MA). The static nature of the price levels allows for quick and easy indication. It allows traders to anticipate and react prudently when price levels are tested. These levels are inflection points where some type of price action is expected – either a bounce (i.e., tested and price bounces from it) or a break (i.e., tested and price breaks and passes through it).
How to use Fibonacci levels – entry and exit
Fibonacci retracement price levels can be used as buy triggers on pullbacks during an uptrend. In downtrends, the levels can be used for short selling when the bounces reject off a Fibonacci retracement level. It is prudent to have a momentum indicator like Relative Strength Index (RSI) or MA to pinpoint the most advantageous entries. When a price level overlaps with other indicator price levels such as a 50-day MA, then it becomes a fortified price level, making it an even stronger support or resistance.
The most significant Fibonacci retracement level to watch for is the 0.618. This level tends to be the maximum pullback zone, where fear climaxes as the final sellers throw in the towel and bargain hunters rush into the market to resume the uptrend. On the downtrends, the 0.618 price level should be where the final buyers are exhausted as sellers take the opportunity to unload their positions and short-sellers jump off the fence to push down the price and resume the downtrend.
Some traders prefer to wait 5% to 10% (some would go to 15%) below or above a Fibonacci retracement level to confirm the support or resistance, respectively, before placing a trade. In fact, the retracement levels observed in the market are never precise. Because of this, such a trade strategy is sensible.
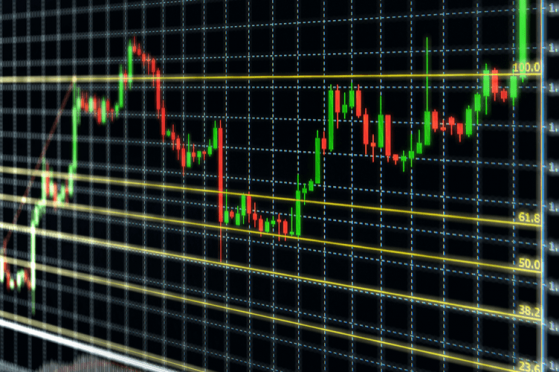
Example with BTC price movement in the past year
Chart 1
Much has been discussed in the media about the recent decline in BTC price since its surge in December of 2017. Will it trend back up, or is it headed for further decline?
Let’s see whether Fibonacci retracement levels could provide us with some guidance.
BTC reached its pick on December 16, 2017, but immediately started descending the day after. A few Fibonacci levels have been tested:
- On December 23, 2017, the 23.6% level was tested. Price broke down through that level, and then went sideways for and few days. On January 6, 2018, the price climbed above that level and fell back down, moving through this level again on January 10, 2018, and testing the next level.
- On January 16, 2018, the 38.2% level was tested. The price broke down through that level on that day. On January 20, 2018, the price briefly came back up to that level, just to swing back down for a sharp decline and test the next level.
- On March 28, 2018, the 61.8% level was tested. The price broke down through that level on that day and moved slightly back up the next day. For a while, price has been lingering, moving sideways and then testing this level again on March 29, 2018.
- On April 6, 2018, the price retraced about 66% (from its peak in December 2017) and has been trending up since then. Could this trend up sustain itself?
To answer this question, we should analyze the level-events leading to that. When we add volume[1] (yellow area in Chart 1) as an additional indicator to the Fibonacci levels, we can get a better understanding of what has happened:
- The peak on December 16, 2017, was not supported with much volume. This indicates that the last surge was most likely to fail (i.e., not sustain a further trend up). Volume increased, however, when the price declined from that level, breaking through the 23.6% level. When on January 6, 2018, the price moved up again, it was not supported with increased volume, leading to the next decline.
- The sell-off was supported with increased volume, especially when the 38.2% level was tested on January 16, 2018.
- For a while volume declined, just to spike again on March 28, 2018, when the 61.8% level was tested.
- During the move up from the 61.8% level (on March 28, 2018), for a couple of weeks, volume remained low and has even been declining. This indicates that we might not be ready yet for a swing up.
From the analysis above it seems that on December 16, 2017, a wise crypto trader, observing that the trend is not supported by volume, should have closed the position and enjoyed the profit he/she had made on the trade. He/she could then put an order to test the 23.6%, 38.2% and 61.8% levels, but then cancel the order when he/she noticed that the price decline is supported with increased volume[2].
So, what is to be expected now?
To answer this question let’s add the 50-day MA to the mix.
Chart 2
Looking at Chart 2, it seems that the 50-day MA has been declining since we tested the 23.6% level. This has also been confirmed with volume declining, in general, and spiking when each level has been tested. The price reversal above MA on March 1, 2018, was not supported with an increase in volume, which explains the immediate price decline on the following couple of days.
On April 6, 2018, price had declined by 66%[3] from its peak, and since then has tried to find its way up. Would it succeed?
Chart 2 indicates a couple of things:
- Volume started to pick up a bit since the 66% level was tested.
- On April 20, 2018, we observed a price reversal (when interacting with 50-day MA), which has been holding up since.
This might indicate that we have reached bottom. This is not only due to the observations mentioned above, but also taking into consideration that we have reached the Golden Ratio level (note, 66% is within that level – see endnote 3.) This confirms the human behavior observed in financial market – that on average, the market retraces back 61.8% in price.
The combined confirmation of a few indicators may signify that BTC is likely to trend up again. This holds unless, of course, news on regulations or other macro-political news might stifle the trend. A wise crypto trader could start placing nimble buy orders at 23.6% level of the decline swing (i.e., 23.6% of the 66% from the peak) and see if it is supported with further increases in volume.
Caveats – what a vigilant crypto trader should know and do
- Since many traders use Fibonacci tool, those levels become self-fulfilling support and resistance levels. Price, however. will not always bounce from these levels. These levels should be considered as “areas of interest”, and should be confirmed with other indicators, such as momentum or volume. The more confirming factors used, the more robust the signal is. (see our example above)
- With traders looking at the same support and resistance levels, there is a good chance that there are a lot of orders at those price levels. While there is no guarantee that the price will bounce from those levels, at least one could be more confident about his/her trade. After all there is strength in numbers.
- Practically speaking, it is unrealistic to expect retracement levels to be reached exactly. Therefore, when making this fully systematic, it is better to allow for the targets to be closer by some percentage in the range of 10% to 15%.
- Markets that have high volume are most likely to conform to standard retracements. This means that index models such as the S&P 500 or high volume financial assets would also show a 50% or 61.8% pullback. Individual stocks (especially small cap), however, may not. Market behavior, after all, is a function of a broad range of participants.
- In the crypto market we should expect to see these retracement levels in high-volume, top crypto-coins, such as BTC or ETH. These levels may not work, however, with low-volume tokens (i.e., at the bottom of the list of traded tokens/coins), such as MintCoin or MediCoin.
It is important to keep in mind that the Fibonacci tool is not always simple to use. If it were simple, traders would always place their orders at Fibonacci retracement levels and the market would trend forever.
Trading is all about probabilities. If you stick to those probability trades, then there is a better chance of coming out ahead in the long run.
About the author:
Dr. Merav Ozair is a data scientist, a quant strategist and a crypto/Blockchain expert. She has more than 12 years of business and consulting experience and more than 15 years of teaching experience working with both graduate students and financial professionals. She holds a PhD in Finance from the NYU Stern School of Business. For questions, comments, or clarification, contact her at mr649@nyu.edu
Endnotes
[1] A trend needs to be supported with participants in the marker (i.e., volume). The lack of participants indicates that the trend most likely will not be able to sustain itself, and traders would be wise to close the trade, and not anticipate further in the advancement in price. The same logic applies when price decline follows an increase in volume: a trader should close out the trade and try again later. Common sense is needed in addition to a retracement target.
[2] A sophisticated trader could have either shorted BTC on these levels or conversely bought puts. (BTC options are traded on the CBOE. We will discuss options trading in future articles).
[3] 66% is still considered around the 61.8%. It is unrealistic to expect retracement levels to be precise.
This article appeared first on Cryptovest