Breaking News
Investing Pro 0
Last Call for Cyber Monday! Save Now on Claim 60% OFF

Texas power demand hits record, more highs seen in heat wave

Published Jul 12, 2023 08:16AM ET Updated Jul 12, 2023 08:25PM ET
Saved. See Saved Items.
This article has already been saved in your Saved Items
 
© Reuters. FILE PHOTO: Utility poles lead to downtown Dallas during a heat advisory due to scorching weather in Dallas, Texas, U.S. July 12, 2022. REUTERS/Shelby Tauber/File Photo

(Reuters) -Demand for power in Texas hit a record high on Wednesday as homes and business cranked up air conditioners during a lingering heatwave, according to data from the state's power grid operator.

ERCOT said power use reached a preliminary 81,351 megawatts (MW) at 6 p.m. CST (2300 GMT), topping the grid's previous record of 80,828 MW set on June 27.

Peak demand is expected to set another record at 83,454 MW on Thursday.

Meteorologists at AccuWeather forecast high temperatures in Houston, the biggest city in Texas, would hit 100 degrees Fahrenheit (37.8 Celsius) almost every day from July 12-19. That compares with a normal high of 94 F for this time of year.

The Electric Reliability Council of Texas (ERCOT), which operates the grid for more than 26 million customers representing about 90% of the state's power load, has said it has enough resources available to meet the soaring demand.

Texas residents have worried about extreme weather since a deadly storm in February 2021 left millions without power, water and heat for days as ERCOT scrambled to prevent a grid collapse after the closure of an unusually large amount of generation.

One megawatt can power around 1,000 U.S. homes on a typical day, but only about 200 homes on a hot summer day in Texas.

Since mid-June, the grid has projected demand would hit record highs on at least 13 days, but usage has only set an all-time high twice this year.

With the heat building, day-ahead power prices settled at between $100 and $330 per megawatt hour for eight hours for Thursday afternoon. Real-time prices at HB Houston node were at$143 as of 6:30 p.m. CST, after touching $1,372 at 4:30 p.m. CST on Wednesday, according to the ERCOT website.

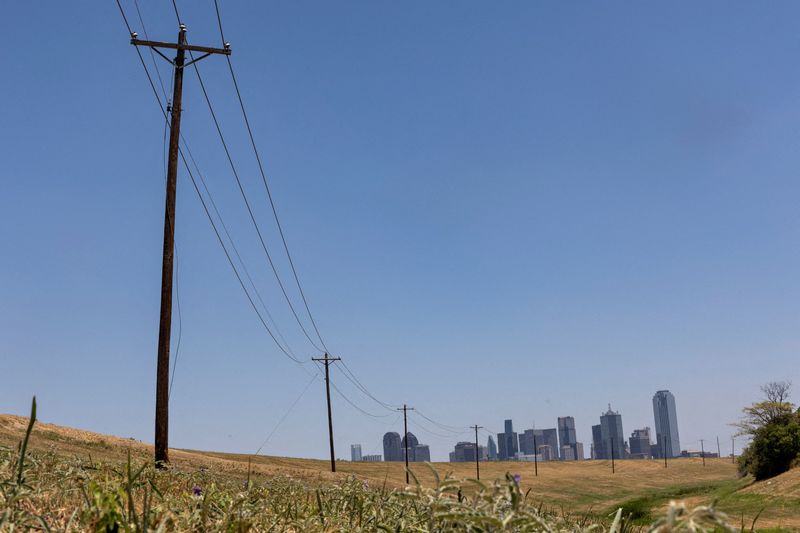
Next-day or spot prices at the ERCOT North Hub, which includes Dallas, rose more than 200% to hit $123 per megawatt hour for Wednesday. That compares with an average of $33 so far this year, $78 in 2022 and a five-year (2018-2022) average of $66.

Texas power demand hits record, more highs seen in heat wave
 

Related Articles

Add a Comment

Comment Guidelines

We encourage you to use comments to engage with other users, share your perspective and ask questions of authors and each other. However, in order to maintain the high level of discourse we’ve all come to value and expect, please keep the following criteria in mind:  

  •            Enrich the conversation, don’t trash it.

  •           Stay focused and on track. Only post material that’s relevant to the topic being discussed. 

  •           Be respectful. Even negative opinions can be framed positively and diplomatically. Avoid profanity, slander or personal attacks directed at an author or another user. Racism, sexism and other forms of discrimination will not be tolerated.

  • Use standard writing style. Include punctuation and upper and lower cases. Comments that are written in all caps and contain excessive use of symbols will be removed.
  • NOTE: Spam and/or promotional messages and comments containing links will be removed. Phone numbers, email addresses, links to personal or business websites, Skype/Telegram/WhatsApp etc. addresses (including links to groups) will also be removed; self-promotional material or business-related solicitations or PR (ie, contact me for signals/advice etc.), and/or any other comment that contains personal contact specifcs or advertising will be removed as well. In addition, any of the above-mentioned violations may result in suspension of your account.
  • Doxxing. We do not allow any sharing of private or personal contact or other information about any individual or organization. This will result in immediate suspension of the commentor and his or her account.
  • Don’t monopolize the conversation. We appreciate passion and conviction, but we also strongly believe in giving everyone a chance to air their point of view. Therefore, in addition to civil interaction, we expect commenters to offer their opinions succinctly and thoughtfully, but not so repeatedly that others are annoyed or offended. If we receive complaints about individuals who take over a thread or forum, we reserve the right to ban them from the site, without recourse.
  • Only English comments will be allowed.
  • Any comment you publish, together with your investing.com profile, will be public on investing.com and may be indexed and available through third party search engines, such as Google.

Perpetrators of spam or abuse will be deleted from the site and prohibited from future registration at Investing.com’s discretion.

Write your thoughts here
 
Are you sure you want to delete this chart?
 
Post
Post also to:
 
Replace the attached chart with a new chart ?
1000
Your ability to comment is currently suspended due to negative user reports. Your status will be reviewed by our moderators.
Please wait a minute before you try to comment again.
Thanks for your comment. Please note that all comments are pending until approved by our moderators. It may therefore take some time before it appears on our website.
Comments (1)
Dan OGrady
Dan OGrady Jul 12, 2023 7:50PM ET
Saved. See Saved Items.
This comment has already been saved in your Saved Items
Power went out yesterday for about one hour in Houston. As a Houston resident, I will not surprised at all if the grid eventually breaks for quite some time
Paul Browning
Paul Browning Jul 12, 2023 7:50PM ET
Saved. See Saved Items.
This comment has already been saved in your Saved Items
Surprisingly Texas has recently deployed a fair amount of wind and solar power which is why their grid has held up better than in the past.
 
Are you sure you want to delete this chart?
 
Post
 
Replace the attached chart with a new chart ?
1000
Your ability to comment is currently suspended due to negative user reports. Your status will be reviewed by our moderators.
Please wait a minute before you try to comment again.
Add Chart to Comment
Confirm Block

Are you sure you want to block %USER_NAME%?

By doing so, you and %USER_NAME% will not be able to see any of each other's Investing.com's posts.

%USER_NAME% was successfully added to your Block List

Since you’ve just unblocked this person, you must wait 48 hours before renewing the block.

Report this comment

I feel that this comment is:

Comment flagged

Thank You!

Your report has been sent to our moderators for review
Continue with Google
or
Sign up with Email