
I covered the main SPX charts and also charts for Dow, RUT, NDX and COMPQ in yesterday’s post arguing the case for a strong reversal to new retracement lows from the rally highs made on Friday. I was making two key points in that post, which were firstly that there has not been a year in the last fifty without a test of either the SPX 200 DMA or the weekly lower bollinger band, and we haven’t seen either tested so far in 2013. If that continues through to the end of 2013 then that would therefore be a real statistical rarity or unicorn event. The second point was that clear pattern resistance was tested at the high on Friday on SPX, Dow, RUT, NDX and COMPQ, so these indices are all at trendline resistance. A break significantly over Friday’s highs would therefore be a bullish breakout in my view until demonstrated otherwise.
This gives the bear side a strong edge this week, though it doesn’t be any means preclude a break up. The other unicorn event that we will have seen in 2013 of course is QE running through the entire year beginning to end. Until we see a break up here however, the assumption needs to be that the next move is down.
On ES declining resistance from the high was tested at the high on Friday, ES is in a rising channel from the last low, and the intraday decline on Friday has set up a possible double top on ES targeting new retracement lows. I have the ES 50 hour MA at 1655, the weekly pivot point at 1649.5, and the double-top trigger level at 1638.75. ES 60min chart: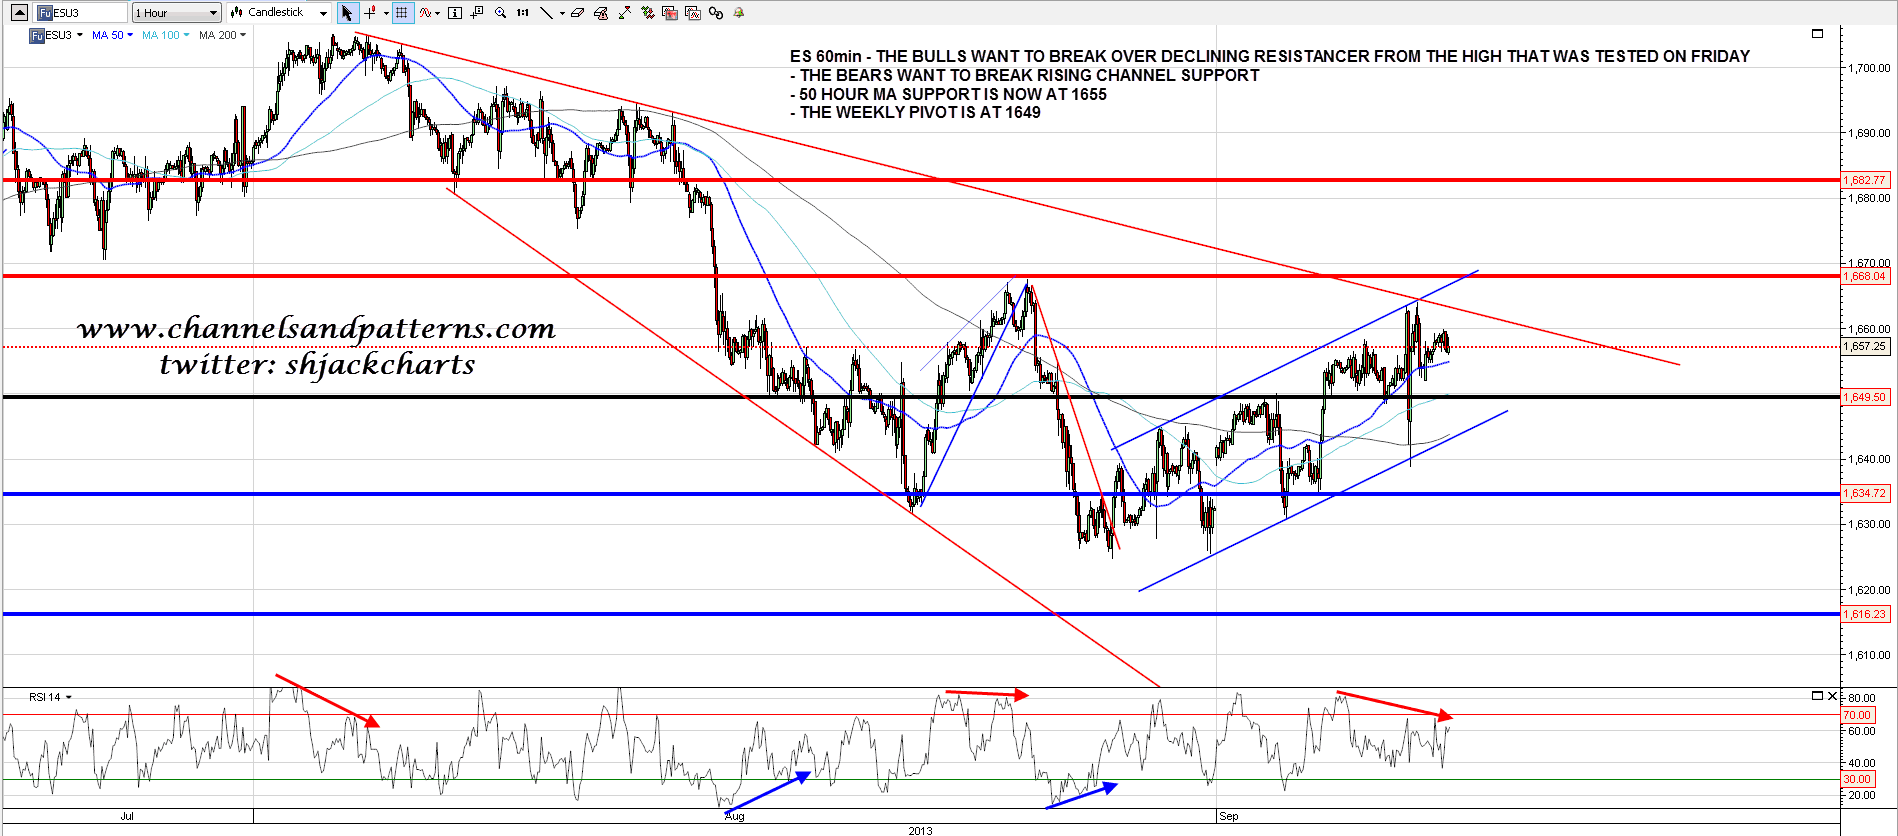
On bonds the possible double-bottom on ZB is developing nicely, with ZB at 129’22 at the time of writing. I haven’t got a huge amount of conviction on this one but a bullish rising wedge on ZB broke up and retested on Friday and if we are going to see this falling knife bounce this year this should be the place. I’ll be watching for signs of a reversal back down however. ZB 60min chart: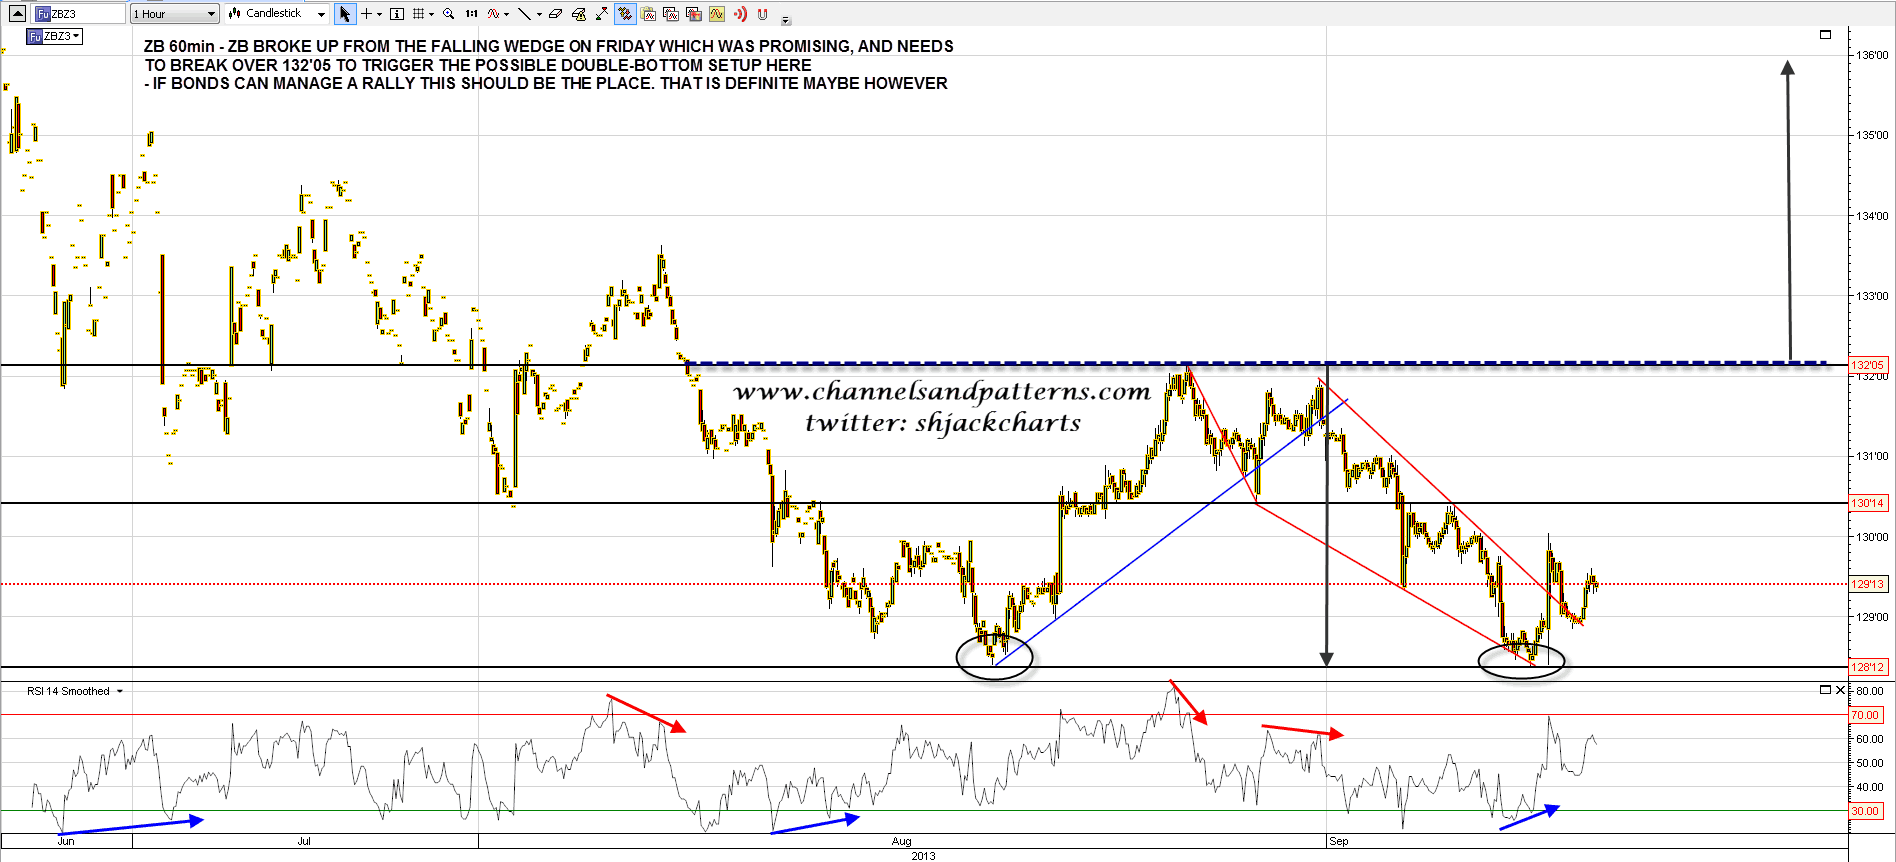
CL made a decisive break up from the IHS on Friday and has since been consolidating between 110 and 110.50. If short term rising support holds then a bull flag has been forming for the next move up. If that rising support breaks however then I’d be looking for a possible retest of the IHS neckline in the 109 area. CL 60min: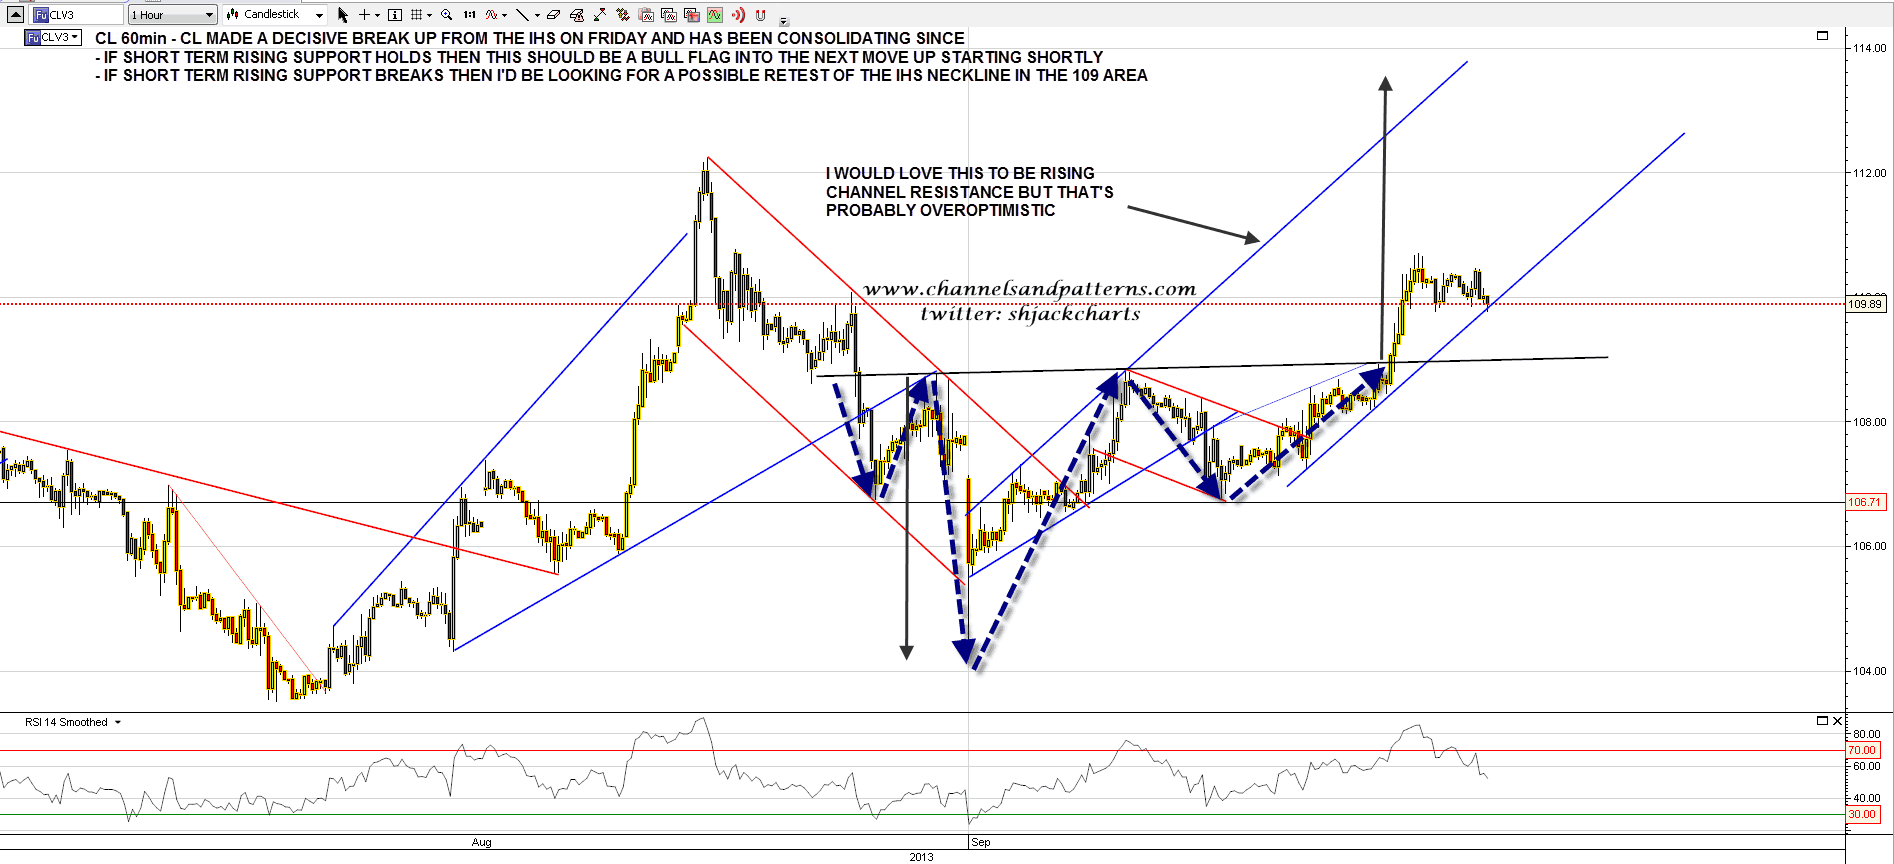
On EURUSD the double-bottom scenario targeting 1.295 is very much alive, but EURUSD made a marginal new low on positive RSI divergence on Friday morning and has been rallying since. I’m looking for resistance at or below 1.3224 before the downtrend resumes. EURUSD 60min chart: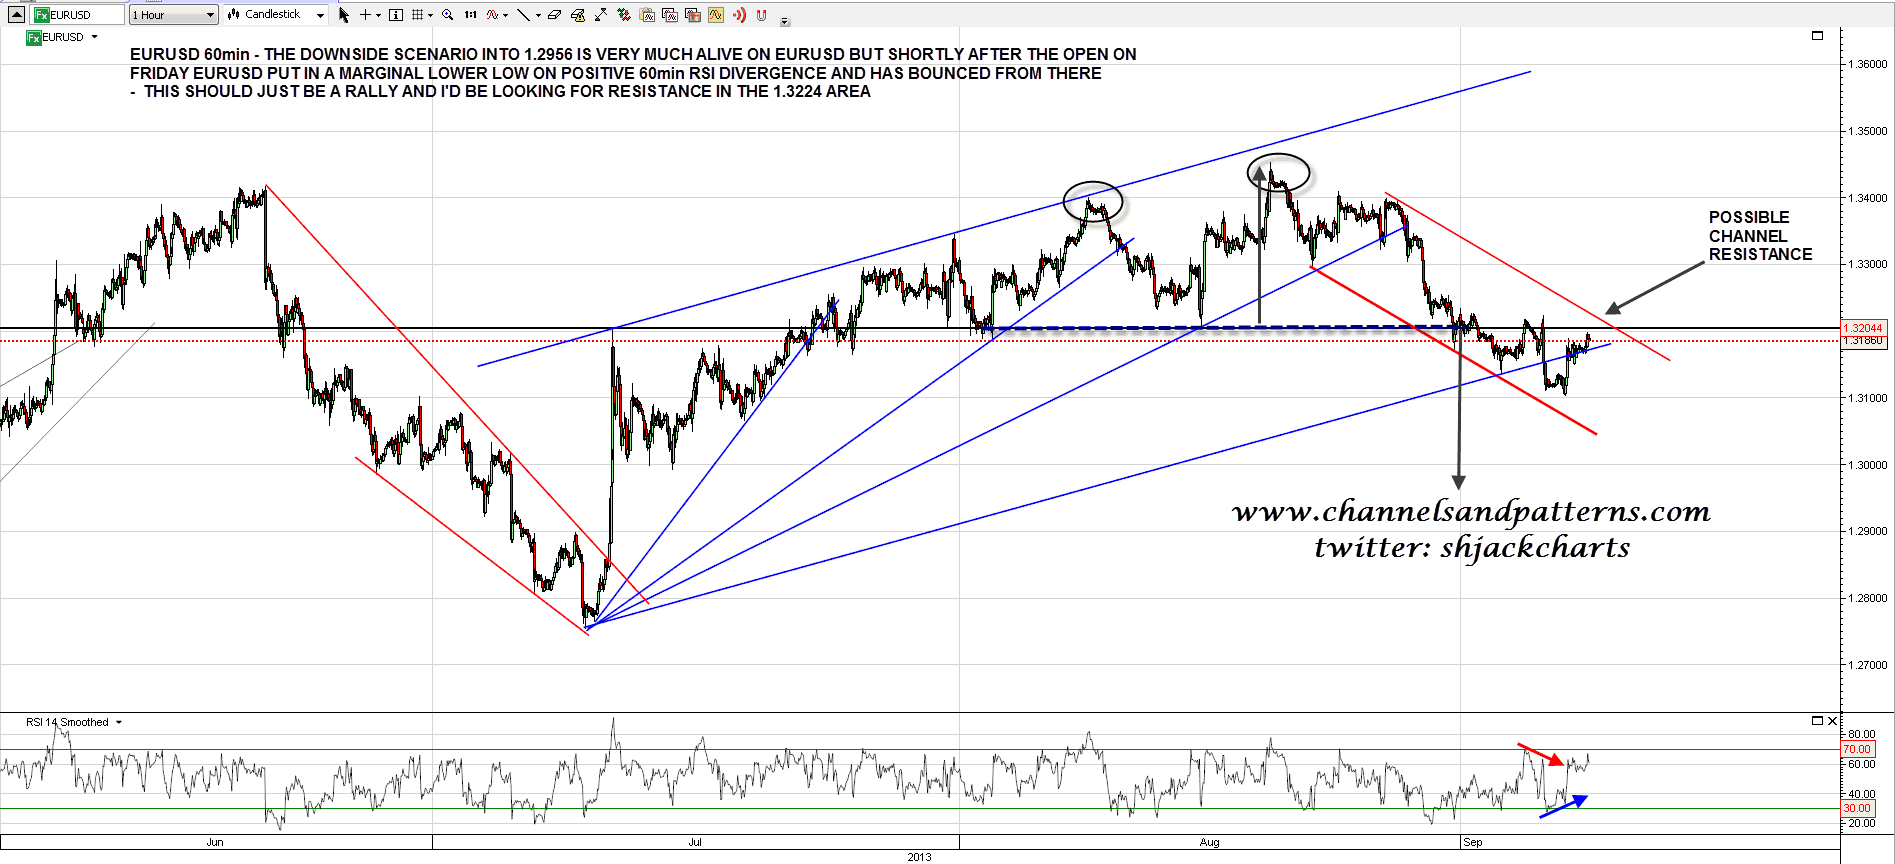 EUR/USD" width="1895" height="864">
I’m in two minds about precious metals here as the move from the lows that we have seen so far may just be a counter-trend rally, or the main trend may have reversed back to bullish. Helpfully there are possible IHS patterns now forming throughout the PMs complex and one of those in on silver futures (SI). The obvious right shoulder low would be in the 22 area and at that stage I would expect SI to reverse to complete the IHS or continue downwards to retest the lows. If the IHS completes forming I would assume that precious metals are back in a bull market. SI 60min chart: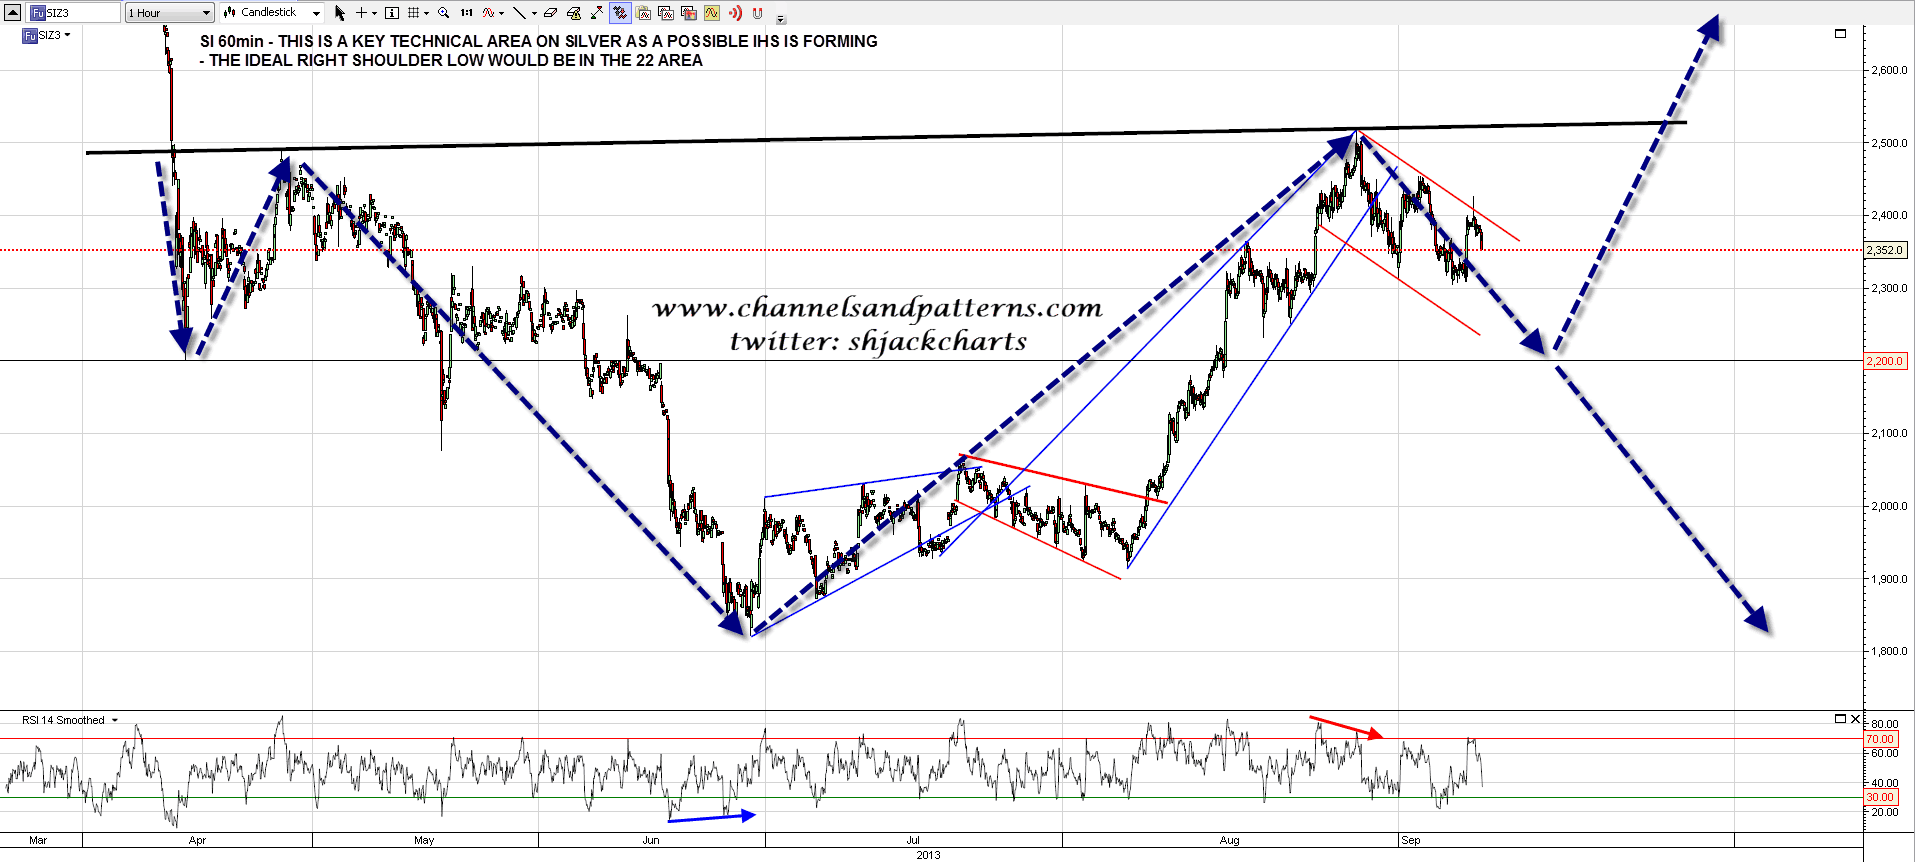
I haven’t posted an Apple (AAPL) chart in a few days but I’m reading the recent consolidation there as a bull flag. That could break up shortly or continue to form into rising support over the next few days but either way I’m expecting the next significant move to be upwards into the 540 area double-bottom target. AAPL 60min chart: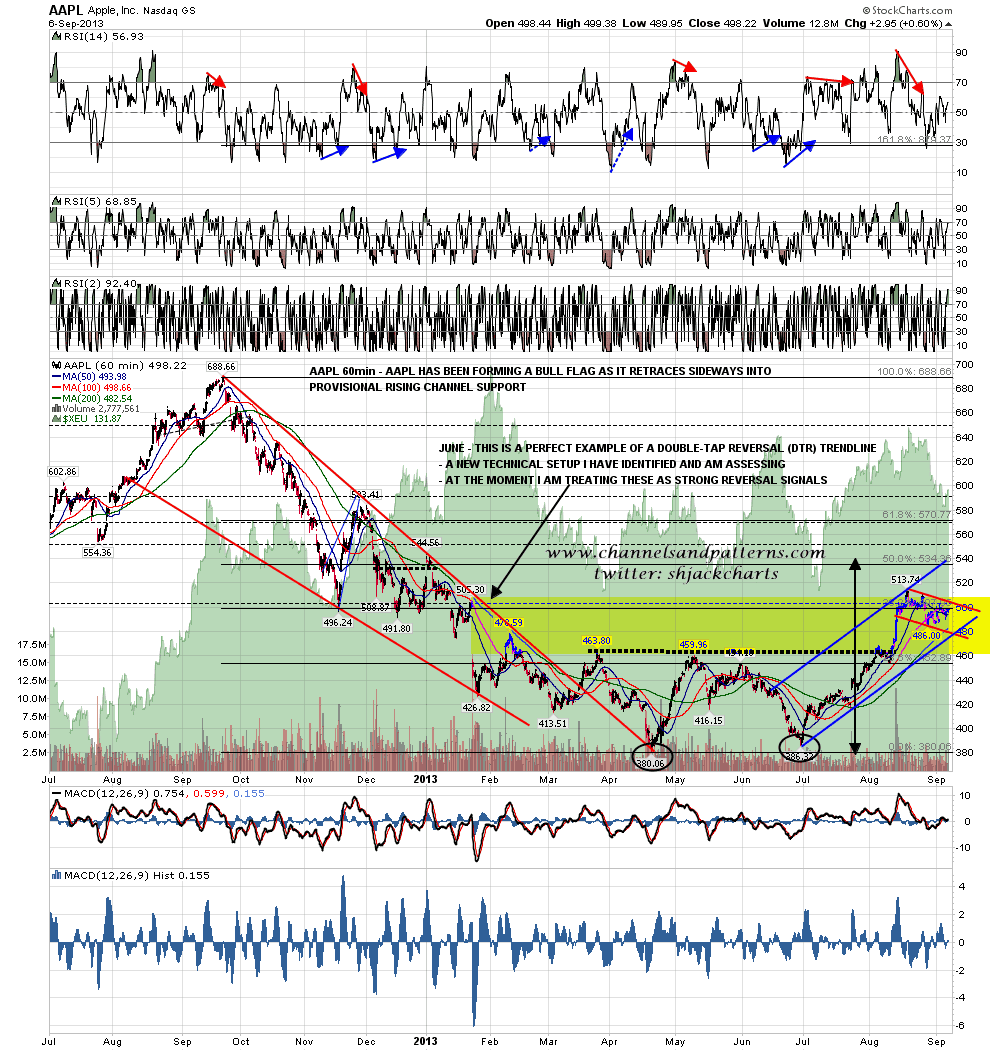
The two key support breaks in this retracement so far were made with big breakaway gaps down through support. We’re not likely to see that today it seems so we may well consolidate and possibly retest the Friday highs today. I’d see a close under the weekly pivot point at 1649.50 ES as bearish and a clear break over Friday’s highs as a bullish break, though with the proviso that SPX might then reverse at 1669/70 resistance to form the right shoulder on an IHS.
I don’t talk much about what I do during the usual trading day, but I tend to spend those playing intraday setups with some very talented traders. One of those is Mike Vacchi of Princeton Trader and I use his proprietary vol levels every day as they are very often key support and resistance levels. I’m mentioning Mike today as his vol levels on Friday were 1638.5 lower vol and 1664.75 higher vol. Those numbers almost perfectly defined the day on Friday and I am tipping my hat to Mike for the great work he does on intraday ES trading.
- English (UK)
- English (India)
- English (Canada)
- English (Australia)
- English (South Africa)
- English (Philippines)
- English (Nigeria)
- Deutsch
- Español (España)
- Español (México)
- Français
- Italiano
- Nederlands
- Português (Portugal)
- Polski
- Português (Brasil)
- Русский
- Türkçe
- العربية
- Ελληνικά
- Svenska
- Suomi
- עברית
- 日本語
- 한국어
- 简体中文
- 繁體中文
- Bahasa Indonesia
- Bahasa Melayu
- ไทย
- Tiếng Việt
- हिंदी
Year Of The Unicorns? Bears Have The Edge, QE Continues
Published 09/10/2013, 12:22 AM
Updated 07/09/2023, 06:31 AM
Year Of The Unicorns? Bears Have The Edge, QE Continues
3rd party Ad. Not an offer or recommendation by Investing.com. See disclosure here or
remove ads
.
Latest comments
Install Our App
Risk Disclosure: Trading in financial instruments and/or cryptocurrencies involves high risks including the risk of losing some, or all, of your investment amount, and may not be suitable for all investors. Prices of cryptocurrencies are extremely volatile and may be affected by external factors such as financial, regulatory or political events. Trading on margin increases the financial risks.
Before deciding to trade in financial instrument or cryptocurrencies you should be fully informed of the risks and costs associated with trading the financial markets, carefully consider your investment objectives, level of experience, and risk appetite, and seek professional advice where needed.
Fusion Media would like to remind you that the data contained in this website is not necessarily real-time nor accurate. The data and prices on the website are not necessarily provided by any market or exchange, but may be provided by market makers, and so prices may not be accurate and may differ from the actual price at any given market, meaning prices are indicative and not appropriate for trading purposes. Fusion Media and any provider of the data contained in this website will not accept liability for any loss or damage as a result of your trading, or your reliance on the information contained within this website.
It is prohibited to use, store, reproduce, display, modify, transmit or distribute the data contained in this website without the explicit prior written permission of Fusion Media and/or the data provider. All intellectual property rights are reserved by the providers and/or the exchange providing the data contained in this website.
Fusion Media may be compensated by the advertisers that appear on the website, based on your interaction with the advertisements or advertisers.
© 2007-2024 - Fusion Media Limited. All Rights Reserved.