- Monitoring purposes SPX: Neutral
- Monitoring purposes Gold: Sold GDX on 6/10/16 at 25.96 = gain 14.97%. Long GDX on 5/31/16 at 22.58.
- Long-Term Trend monitor purposes: Short SPX on 1/13/16 at 1890.28croex

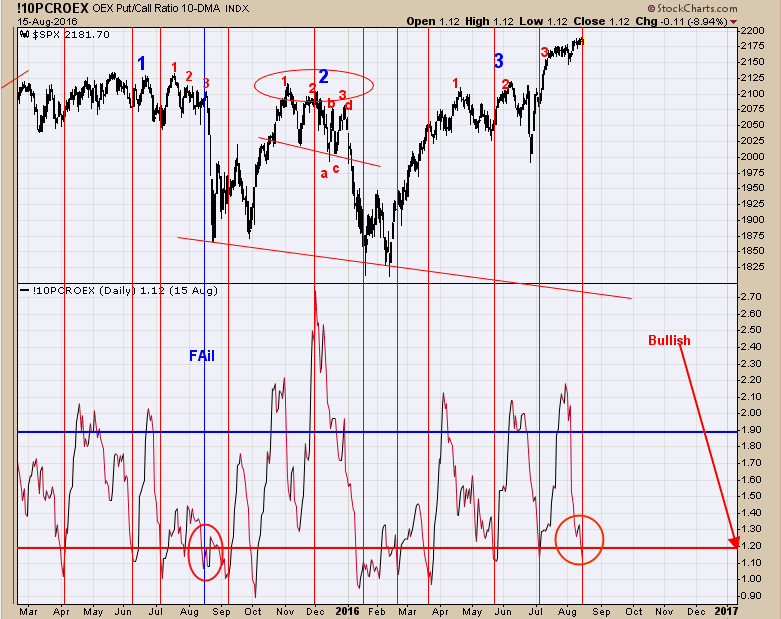
The bottom window is the 10 period average for the OEX put/call ratio. Readings above 1.90 have been bearish for the market and readings below 1.20 have been bullish. This ratio came in at 1.12 yesterday which suggests bullishness for the market. We have circled in red the last august reading which was also below 1.20 and the market fell hard over the next several days and is the only time on the chart that failed to rally with a bullish put/call ratio reading. I might add that there is a 71% probability that market will at least hold up if not move modestly higher into the August 17 timeframe (Wednesday) (according to Traders Almanac election seasonality). Also this is option expiration week which normally has a bullish bias. FOMC meeting minutes come tomorrow and there is a New Moon on Thursday which may affect the markets. Seasonality also points to a top late August to early September which could lead to a decline that could last into October November timeframe.

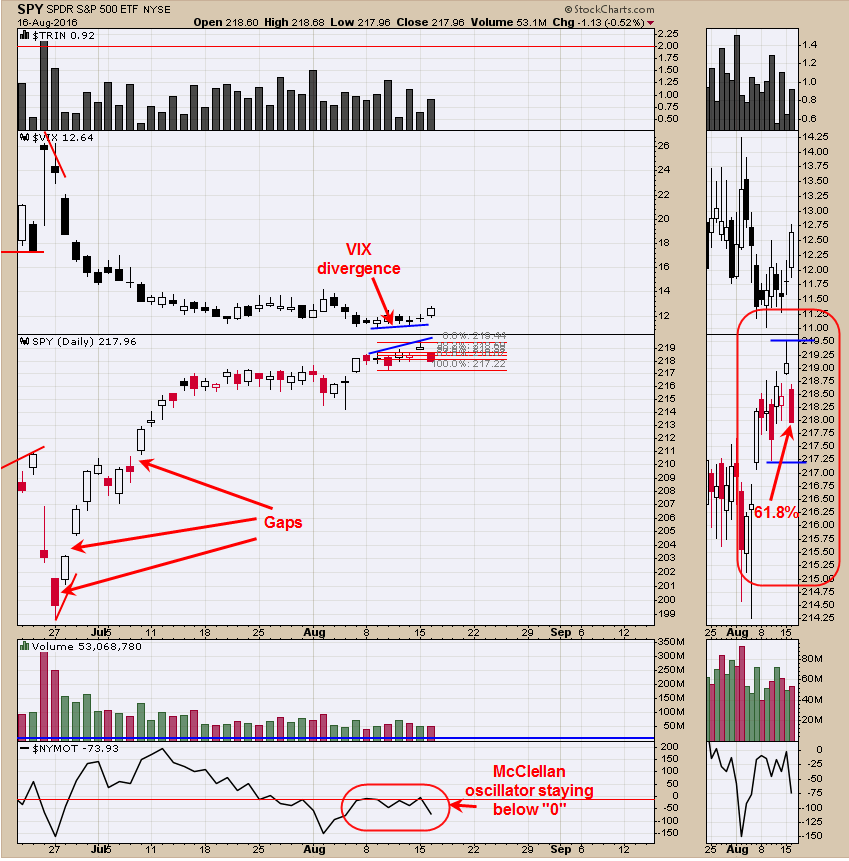
Timer Digest has the Ord Oracle ranked 9thin performance for the last 12 months updated 8/13/16. The bottom window is the NYSE McClellan oscillator which as been staying below “0” in a bearish manner. The rally up from the June low left several open gaps and most open gaps get filled at some point and remains a bearish sign for the SPY (NYSE:SPY). To day’s modest decline retraced over 61.8% of the minor rally to yesterday’s high. This retracement could be the start of the topping process. FOMC minutes are tomorrow and there is a Full moon on Thursday and Friday is ends option expiration week all of which could produce volatility in the market. Still neutral for now.

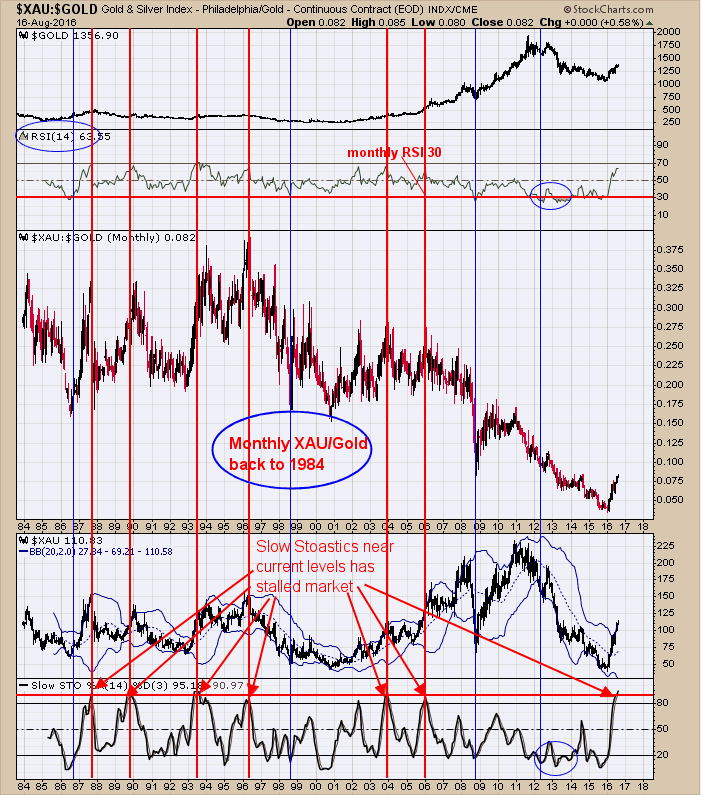
The middle is the monthly XAU/Gold ratio going back to 1984. The bottom window is the Slow stochastics of the XAU/Gold ratio. The XAU has stalled when the Slow Stochastics of the monthly XAU/Gold ratio reached above 90 (current reading is 95.10). The XAU has over doubled from the January low and it would be reasonable to think market is due for a rest. What we don’t know is how the “rest” will materialize. A “rest” could come in the form of a sideways consolidation or could have a retracement. The internal strength for GDX remains relative stable and not showing strong weakness which suggests a sideways consolidation is the more likely outcome. What appears to be happening is the stronger gold issues are taking a rest and the lagers are starting to perform showing a rotation is going on rather than a mass exit. Staying neural for now. Sold GDX on 6/10/16 at 25.96 = Gain 14.97%.
