
Wyndham Worldwide Corporation (NYSE:WYN) reported strong second-quarter 2017 results wherein both earnings and revenues surpassed the Zacks Consensus Estimate.
Shares of the company have gained nearly 5% in after-hours trading on Aug 2, after the company announced plans to spin-off its hotel business.
Restructuring
Wyndham announced plans to spin off the company's hotel business, Wyndham Hotel Group, resulting in two separate publicly traded companies. Subsequently, Wyndham Vacation Ownership will become the world's largest publicly traded timeshare company. Also, it will be joined with Wyndham Destination Network, the world's largest timeshare exchange company.
The transaction will be effected through a pro rata distribution of the new hotel company's stock to existing shareholders. It is expected to be completed in the first half of 2018.
Earnings and Revenue Discussion
Adjusted earnings of $1.53 per share beat the Zacks Consensus Estimate of $1.50 by 2%. Also, earnings were up 9.3% year over year on the back of higher revenues as well as the company’s share repurchase program.
Additionally, net revenues of $1.48 billion improved 5.4% year over year on the back of increased contribution from all of its segments. Moreover, revenues outpaced the Zacks Consensus Estimate of $1.47 billion by 0.7%.
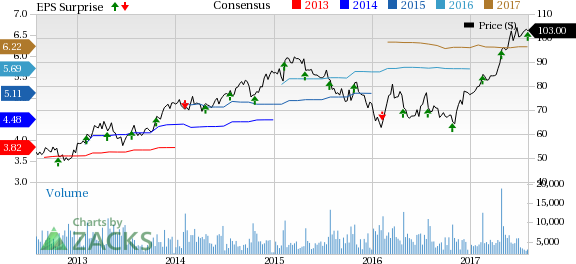
Wyndham Worldwide Corp Price, Consensus and EPS Surprise
Inside the Headline Numbers
Adjusted EBITDA (excluding share-based compensation expenses) increased 2.9% year over year to $350 million.
Notably, Wyndham has been functioning through its three operating segments: Hotel Group, Destination Network (formerly known as Vacation Exchange and Rentals) and Vacation Ownership.
Hotel Group revenues were $345 million, up 3.3% from the year-ago figure, which reflected higher franchise fees as well as growth in the company's Wyndham Rewards credit card program.
Domestic same store RevPAR improved 2.8%. At constant currency, global system-wide same store RevPAR increased 3.3% year over year.
Adjusted EBITDA increased 5% to $106 million. On a currency-neutral basis adjusted EBITDA grew 6%.
Revenues at Destination Network were $405 million, an increase of 5% from the year-ago figure.
Exchange revenues remained flat year over year at $159 million. In fact, the figure grew 1% at constant currency, as the exchange revenue per member rose 2.4%, and average number of members declined 1.7%.
Vacation rental revenues were $220 million, reflecting 8.9% year-over-year growth. Likewise, at constant currency and excluding acquisitions, vacation rental revenues increased 9% driven by a 7.8% increase in transaction volumes and a 0.9% increase in average net price per rental.
Adjusted EBITDA increased 5% to $89 million, reflecting stronger performance in vacation rental brands. On a currency-neutral basis, adjusted EBITDA increased 6%.
Revenues at Vacation Ownership increased 6% year over year to $750 million. The uptick reflects an increase in gross VOI sales as well as higher consumer financing revenues, partially offset by a higher provision for loan losses.
Gross VOI sales in the second quarter increased 9% year over year. Meanwhile, tour flow was up 10.3% but volume per guest (VPG) was down 1.1%, primarily reflecting a 14% increase in sales to new owners in North America, which produce a lower VPG.
Adjusted EBITDA decreased 2% to $183 million as the increase in revenues was offset by higher legal expenses and the absence of a $4 million benefit from business interruption insurance claims received in the prior-year quarter.
2017 Guidance
For 2017, the company continues to project adjusted net income in the range of $631 million to $652 million. However, adjusted earnings per share are anticipated in a band of $6.04 to $6.24, higher than the previously expected range of $5.98 to $6.18 per share. This, in turn, reflects a lower share count due share due to possible share repurchases. The Zacks Consensus Estimate for 2017 earnings is currently pegged at $6.22 per share.
Wyndham continues to expect full-year revenues to roughly come in the range of $5.80–$5.95 billion. Adjusted EBITDA is still projected to be approximately in a band of $1.41 billion to $1.44 billion.
Zacks Rank & Peer Releases
Wyndham currently has a Zacks Rank #3 (Hold). You can see the complete list of today’s Zacks #1 Rank (Strong Buy) stocks here.
Among other hotel stocks, Hilton Worldwide Holdings, Inc. (NYSE:HLT) reported second-quarter adjusted earnings per share of 52 cents beating the Zacks Consensus Estimate of 50 cents by 4%. Moreover, earnings soared 30% year over year.
Extended Stay America, Inc.’s (NYSE:STAY) second-quarter 2017 adjusted earnings were 31 cents per share, which lagged the Zacks Consensus Estimate of 32 cents by 3.12%. Notably, earnings were flat year over year.
In second-quarter 2017, Choice Hotels International, Inc. (NYSE:CHH) posted earnings of 79 cents per share that outpaced the Zacks Consensus Estimate of 77 cents by 2.60%. Further, earnings increased 11.3% year over year.
More Stock News: Tech Opportunity Worth $386 Billion in 2017
From driverless cars to artificial intelligence, we've seen an unsurpassed growth of high-tech products in recent months. Yesterday's science-fiction is becoming today's reality. Despite all the innovation, there is a single component no tech company can survive without. Demand for this critical device will reach $387 billion this year alone, and it's likely to grow even faster in the future.
Zacks has released a brand-new Special Report to help you take advantage of this exciting investment opportunity. Most importantly, it reveals 4 stocks with massive profit potential. See these stocks now>>
Wyndham Worldwide Corp (WYN): Free Stock Analysis Report
Choice Hotels International, Inc. (CHH): Free Stock Analysis Report
Extended Stay America, Inc. (STAY): Free Stock Analysis Report
Hilton Worldwide Holdings Inc. (HLT): Free Stock Analysis Report
Original post