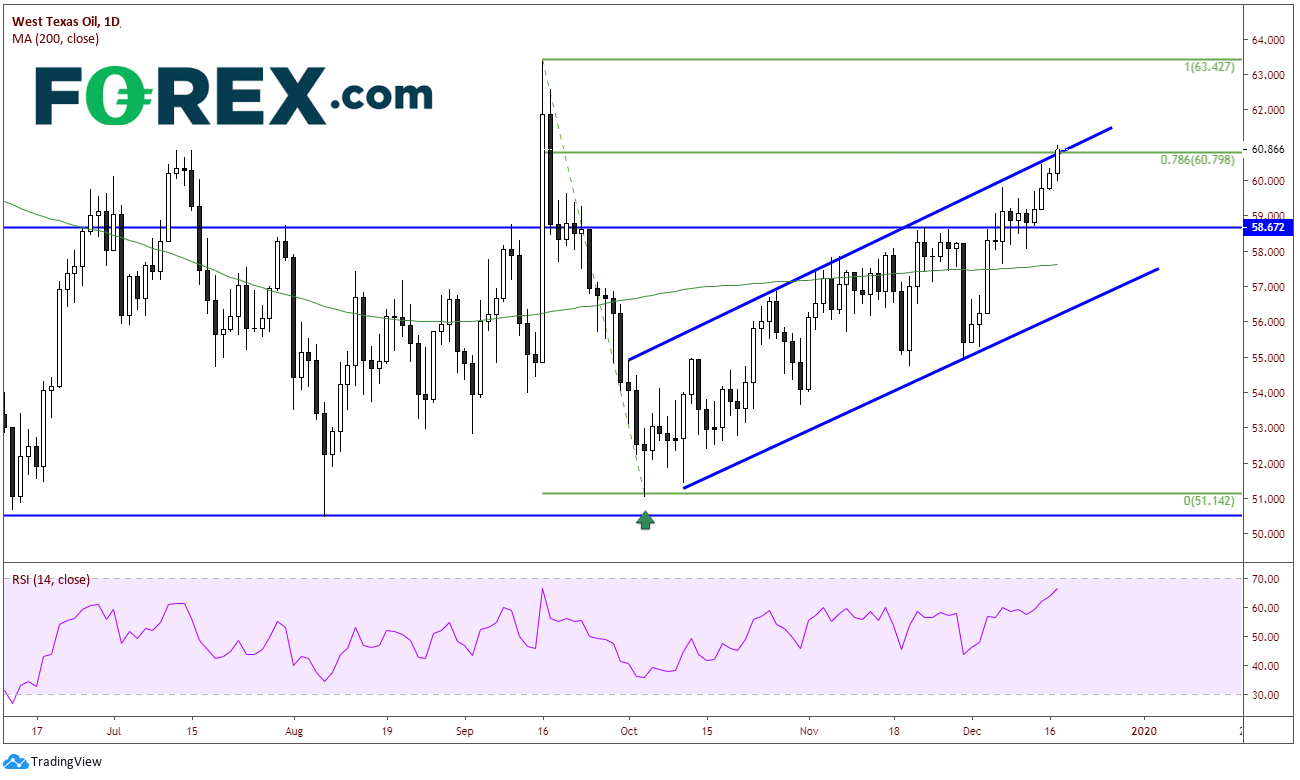
Lest anyone doubt that the U.S.-China agreement is a big deal, they should look at the price of WTI over the last 2 months. Only 3 weeks after the Saudi Aramco (SE:2222) drone attacks, price put in a hammer-low October 3 near 51.00 and began trading in a rising channel. Price then went on to close above the top of the channel near 61.00 (depending how the upper channel trendline is drawn, it may have closed right on the trendline). And although not as widely followed as other Fibonacci levels, price is near the 78.6% Fibonacci retracement level from the September 16 highs to the October 3 lows at 60.80.

What’s even more impressive is the move since December 1, which is when the price of West Texas Oil has rallied 10%. There is a combination of fundamental factors that have helped contribute to this move:
1) The China outlook for oil, as the U.S.-China trade deal has finally been resolved
2) The meeting in Vienna where OPEC members “agreed” to cut production by 500,000 barrels per day
3) The promise from OPEC+ (which includes Russia) to cut back production

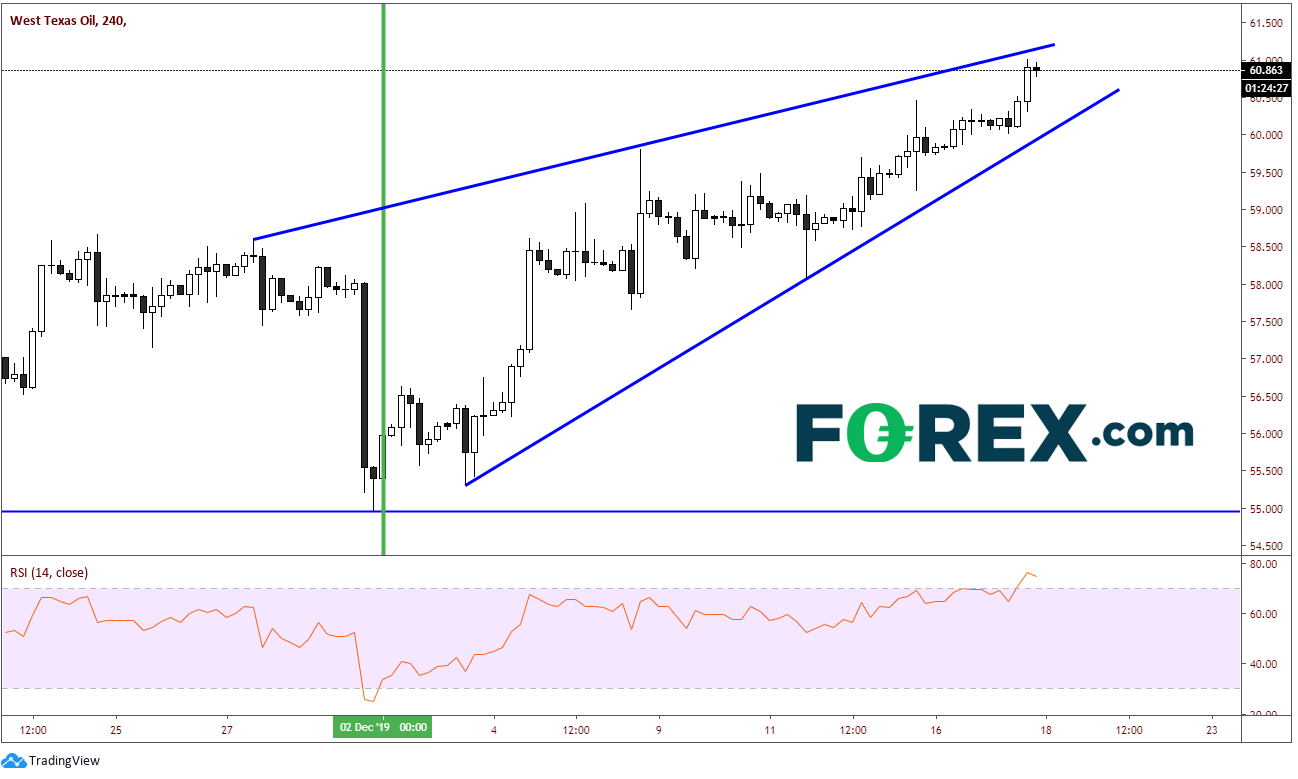
The vertical green line on the 240-minute time frame shows oil's price on Monday, December 2. Price opened at 55.40, after putting in a low near 55.00 in the final bar on Friday, November 29. Since then, WTI has rallied to as high as 61.00 today and has yet to look back. 61.00 may be the “Make It or Break It” level. In addition to this being the rising channel trendline on the daily time frame, price has also formed a rising wedge on the 240-minute chart. Also, the RSI is at overbought levels (however it is not diverging with price).
If WTI can close decisively above 61.00, there isn’t any resistance until the 63.73 level from the September 16 highs. If price breaks lower out of the wedge, the target is a 100% retracement of the wedge, which would be back to 55.00. However, it would have to get through lots of support levels to get there, the first of which is the bottom trendline of the wedge near 60.00. Below that is horizontal support near 58.67 and the 200-day moving average at 57.63 (see daily). Not to mention that depending on where the high of the current move is, there will be Fibonacci retracement levels to watch as price pulls back.
