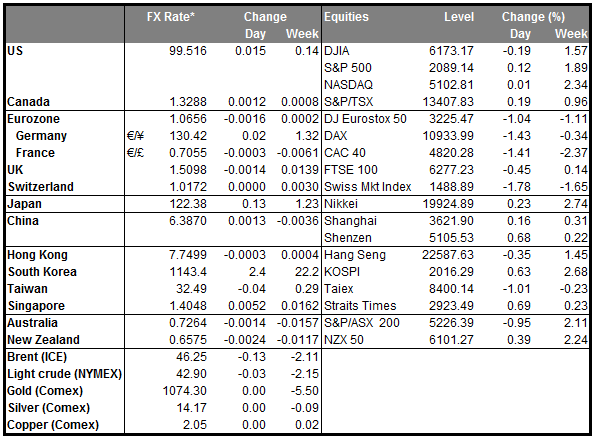
• WTI falls below $30/barrel WTI crude oil tumbled yesterday, briefly falling below the USD 30 level, its lowest intraday price since December 2003. The 12-year low price threatens the survival of a number of oil firms, as they may not be able to remain afloat at the current low prices. It also hints more trouble for major crude-producing nations, who in the absence of major energy-sector investments could experience an increase in their unemployment rates. Case in point is oil giant BP (L:BP), which stated on Tuesday that it would decrease its workforce by 5% in light of the continued tumble in prices and weakening demand. There are no signs that drillers will decrease supply in the foreseeable future, especially with Iranian oil ready to enter the market and drive supply even higher. Additionally, as global demand remains weak by fears of a Chinese slowdown, oil prices as well as oil related currencies like CAD and NOK could remain under selling pressure.
• Chinese trade data stronger than expected China’s total trade activity contracted much less than expected in December. Exports fell 1.4% yoy vs expectations of -8.0% yoy, while imports also fell but not as sharply as expected. The surprising data indicates that exports may be benefiting from the yuan’s depreciation against the dollar, which has continued in the early days of the new year. The improvement in imports may reflect factories stocking up on cheap oil, whose imports rose more than 21% in December, as well as iron ore and other commodities. Overall, the December trade data have offered some signs that the economy may be stabilizing, but at a slow pace. AUD/USD and NZD/USD, which could have otherwise come under renewed selling pressure on the news, had no major reaction.
• Today’s highlights: In Eurozone, industrial production for November is forecast to have fallen, a turnaround from the previous month. Bearing in mind that industrial production in Eurozone’s two largest economies, Germany and France, also fell in November, we see a high likelihood for a soft IP print for the entire bloc as well. A possible fall in the reading could add to concerns that the slowdown in China and other EM markets has started to impact Eurozone’s economy, which could weaken EUR a bit as a result, at least at the release.
• From the US, the Fed will release the Beige Book, which includes a summary and analysis of current economic conditions in each district and sector. This will provide qualitative information to Fed officials on how the US economy has been performing after the first rate hike, ahead of the January 26-27 FOMC meeting.
• We have three speakers scheduled on Wednesday’s agenda: ECB Executive Board member Sabine Lautenschlaeger, Boston Fed President Eric Rosengren and Chicago Fed President Charles Evans speak.
The Market
EUR/USD falls near 1.0800 again
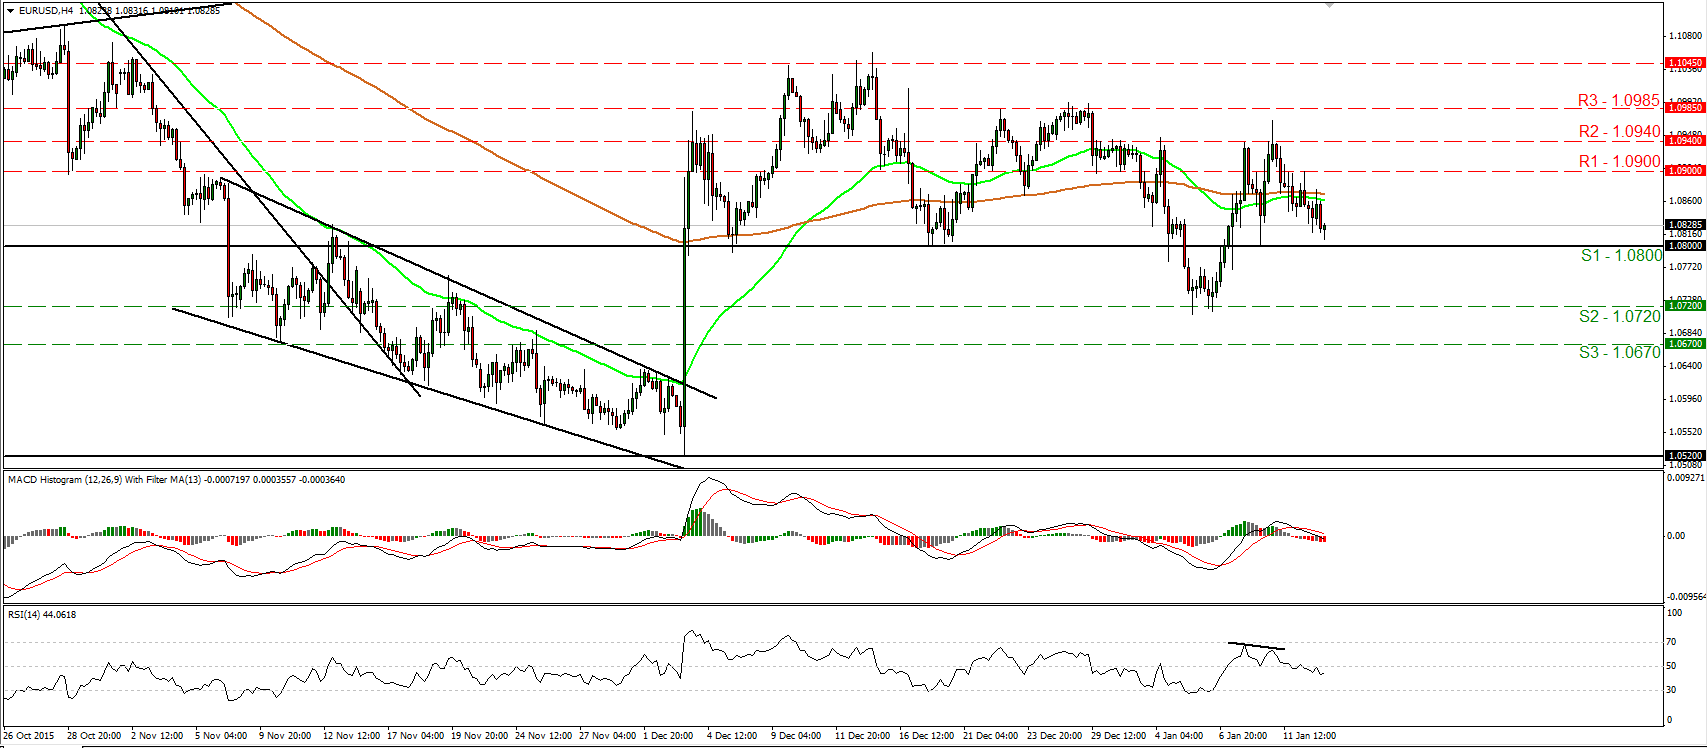
• EUR/USD traded lower on Tuesday after it hit resistance at the 1.0900 (R1) level. However, the decline was stopped once again near the 1.0800 (S1) key support hurdle. Taking into account that the rate remains above the 1.0720 (S2) obstacle, I prefer to maintain my “wait and see” stance for now with regards to the short-term outlook. I would like to see another dip below 1.0800 (S1) before turning my eyes back to the downside. Looking at our momentum studies, I see that the RSI fell below its 50 line, while the MACD, already below its trigger line, has just turned negative. These indicators detect negative momentum and support that EUR/USD is possible to continue trading lower in the near future. Switching to the daily chart, I see that the 1.0800 (S1) key hurdle is the lower bound of the range the pair had been trading from the last days of April until the 6th of November. I also see that on the 7th and 17th of December, and on the 8th of January, the rate rebounded from that zone. Therefore, the fact that the rate is trading above the 1.0800 (S1) zone makes me stay flat as far as the medium-term picture is concerned as well.
• Support: 1.0800 (S1), 1.0720 (S2), 1.0670 (S3)
• Resistance: 1.0900 (R1), 1.0940 (R2), 1.0985 (R3)
EUR/JPY rebounds from 127.45
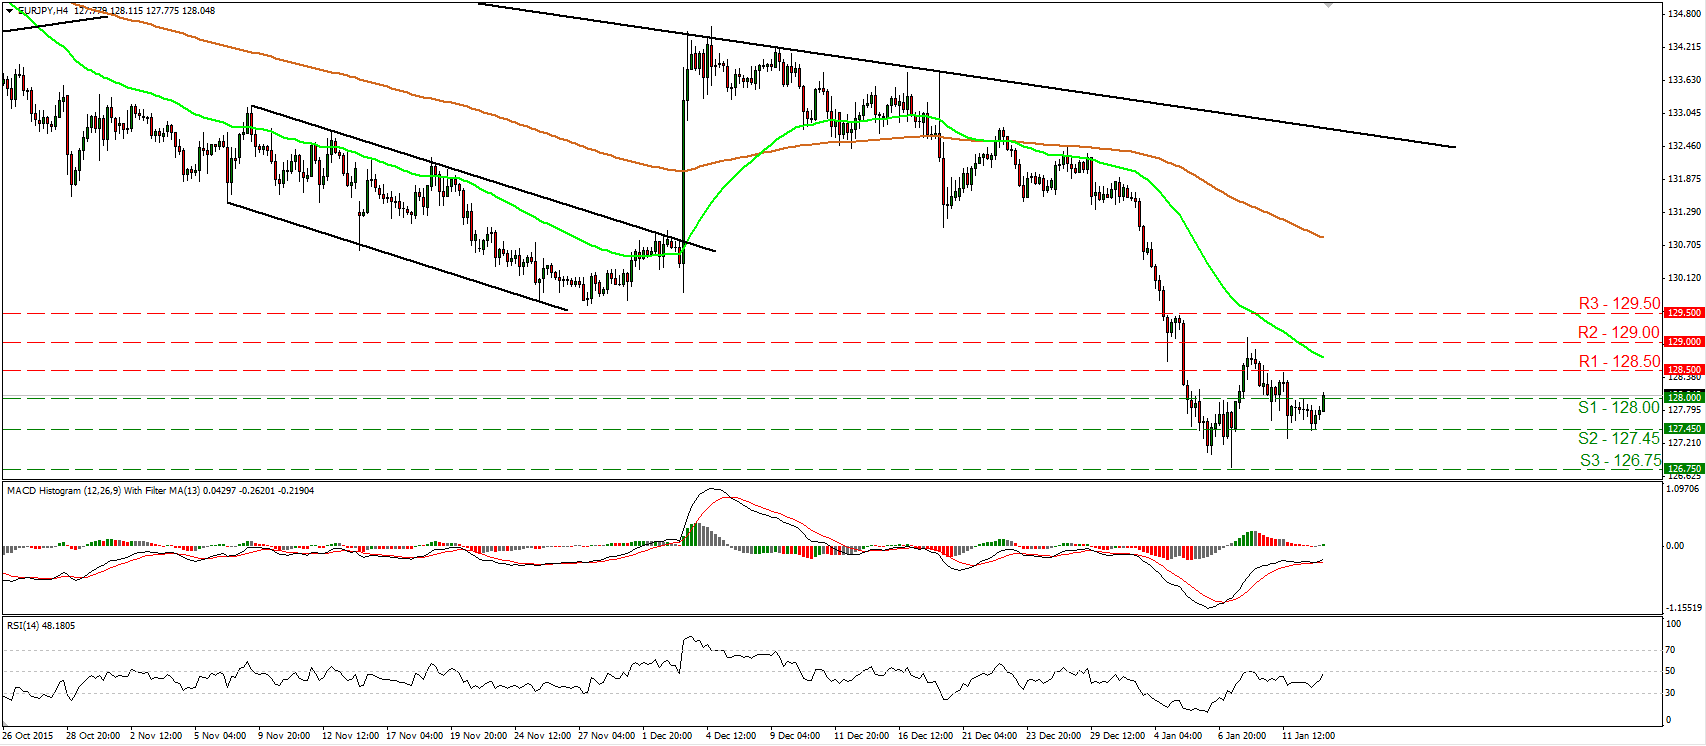
• EUR/JPY edged higher on Tuesday after it hit support at the 127.45 (S2) line. Subsequently, the rate emerged above the 128.00 (S1) hurdle. The fact that the pair printed a higher low near 127.45 (S2) makes me believe that it is poised to continue trading higher for a while, perhaps to challenge the 128.50 (R1) resistance. If the bulls prove strong enough to overcome that barrier, I would expect them to aim for the next resistance zone of 129.00 (R2). Shifting my attention to our momentum indicators, I see that the RSI turned up and looks able to move above its 50 line, while the MACD, although negative, stands above its trigger line and points north as well. Switching to the daily chart, I see that on the 4th of December, the rate started tumbling after it hit resistance near the downtrend line taken from the peak of the 21st of August. Therefore, I would consider the longer-term path of EUR/JPY to be negative. I would treat any future near-term advances as a corrective phase of that downtrend for now.
• Support: 128.00 (S1), 127.45 (S2), 126.75 (S3)
• Resistance: 128.50 (R1), 129.00 (R2), 129.50 (R3)
GBP/USD rebounds from 1.4350
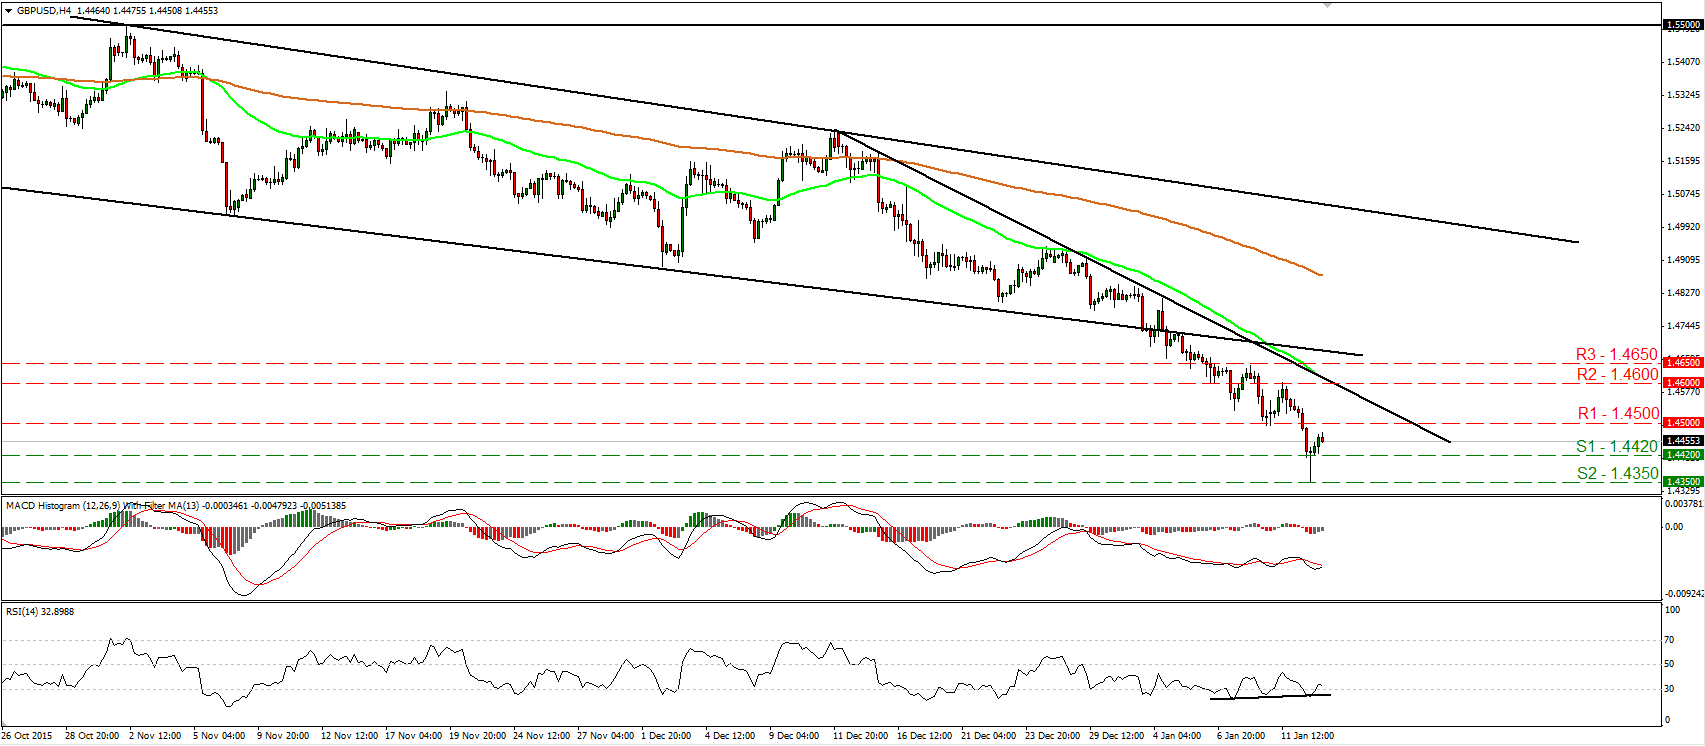
• GBP/USD traded higher yesterday after it triggered some buy orders near the 1.4350 (S2) line. However, the rate is still trading below the psychological line of 1.4500 (R1) and below the downtrend line taken from the peak of the 14th of December. Thus, I still consider the short-term picture to be negative and I would treat yesterday’s rebound, or any extensions of it, as a corrective move. I believe that at some point, the bears will regain their momentum and push the rate down for another test near 1.4350 (S2). Our oscillators though detect slowing downside speed and increase the likelihood for the corrective move to continue for a bit. The RSI exited its below-30 territory, while the MACD, although negative, has bottomed and could move above its trigger line soon. In the bigger picture, the price structure remains lower peaks and lower troughs below the 80-day exponential moving average, which is pointing down. Thus, I still see a negative longer-term picture as well.
• Support: 1.4420 (S1), 1.4350 (S2), 1.4250 (S3)
• Resistance: 1.4500 (R1), 1.4600 (R2), 1.4650 (R3)
Gold slides back below 1090
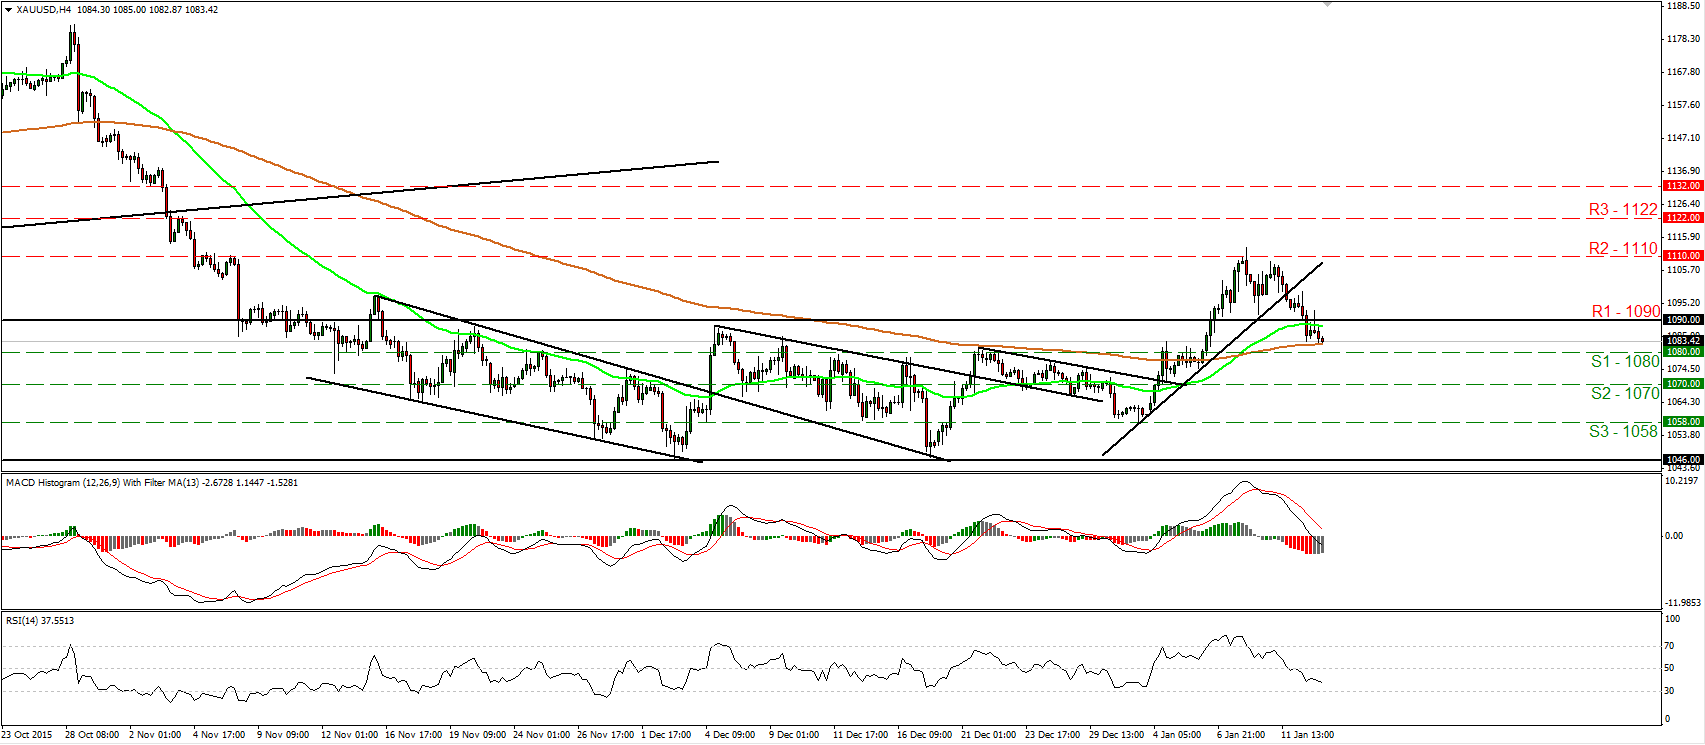
• Gold continued trading lower yesterday and fell back below the 1090 (R1) key support (now turned into resistance) barrier. The metal now is headed towards the next support line of 1080 (S1), where a clear dip is likely to open the way for the 1070 (S2) obstacle. Our short-term oscillators reveal bearish momentum and magnify the case that gold could continue lower for a while. The RSI slid after it fell below its 50 line, while the MACD, already below its signal line, fell below zero and points down. As for the broader trend, I see that the price is back within the range it had been trading since the 16th of November, between the 1046 support and the 1090 (R1) resistance zone. As a result, I would switch my stance back to neutral as far as the medium-term outlook of the yellow metal is concerned.
• Support: 1080 (S1), 1070 (S2), 1058 (S3)
• Resistance: 1090 (R1), 1110 (R2), 1122 (R3)
WTI trades fractionally below 30.00
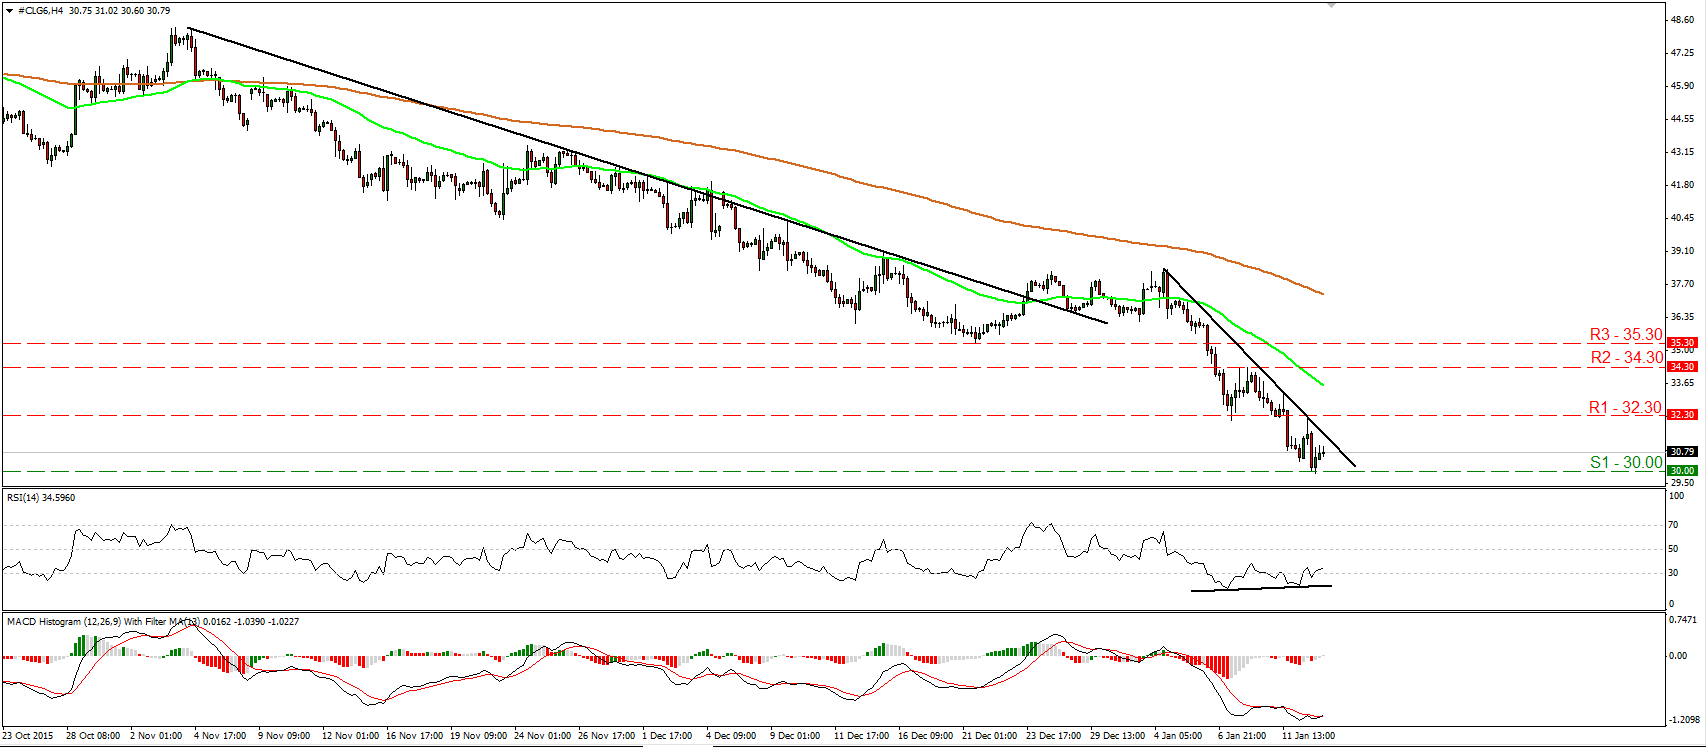
• WTI continued its tumble yesterday and managed to trade fractionally below the psychological zone of 30.00 (S1) for a while. Then the price rebounded somewhat. As long as WTI is trading below the short-term downtrend line drawn from the peak of the 4th of December, I would consider the short-term outlook to stay bearish. I would expect another attempt below the 30.00 (S1) zone to initially aim for the 29.00 (S2) level. Nevertheless, taking a look at our oscillators, I see signs that a corrective bounce could be on the cards before the next negative leg. The RSI exited its below-30 zone, while the MACD has bottomed and just poked its nose above its trigger line. There is also positive divergence between the RSI and the price action. On the daily chart, I see that WTI has been printing lower peaks and lower troughs since the 9th of October. As a result, I would consider the longer-term picture to stay negative as well.
• Support: 30.00 (S1), 29.00 (S2), 28.00 (S3)
• Resistance: 32.30 (R1), 34.30 (R2), 35.30 (R3)


