Crude Oil climbed higher, flying against risk aversion headwinds which sunk US stocks yesterday. The reasons given for the rally appears to be similar as the rally 2 days ago, which can be summarized as "we do not really know" and are making guesses. It is worth noting that analysts are not making wild conjectures, and there appears to be some logical reasoning about speculators betting that the inventory drawdown last week will be larger than expected. However, intelligent guesses are still just that - guesses, and conservative traders should avoid committing into trades when reasons for movements are unclear.
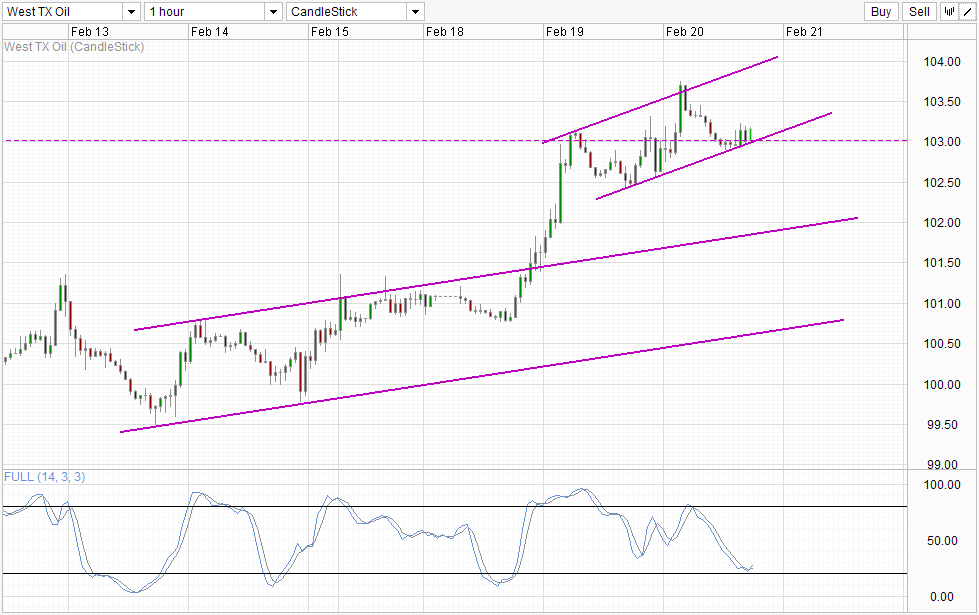
Directional/momentum trend traders will argue and say that bullish momentum is strong, and that is all that matters. But the assertions that bulls are strong isn't entirely true either. Case in point, it should be noted that Crude Oil jumped from 103.06 to a high of 103.74 within the hour when Fed minutes were released. This Fed minutes is more dovish than expected as there are Fed members that wanted to distance away from using Unemployment rate as a barometer for rate hikes, while some want to see continued low interest rates in order to keep the economy going. Hence, it is reasonable that Crude Oil pushed higher due to this news, but it should be noted that both Stocks and Gold behaved bearishly - suggesting that market actually interpreted the minutes as more hawkish than expected. Perhaps there is something to be said about how traders basically interpreted the minutes with their bias tinted glasses (Gold and Stocks were already bearish before the news release while Crude was bullish), but the main point that is demonstrated here is that market is not moving in tandem, which makes dictating direction of Crude that much harder.
Furthermore, Crude prices started to decline after the rally, pushing all the way down, hitting below 103.0 briefly. Some may say that the risk off appetite finally caught up with prices, but that argument doesn't fly as a much weaker than expected Chinese Manufacturing PMI surveyed by HSBC/Markit did not drive WTI prices lower, with prices actually recovering subsequently back above 103.0 where we are currently.
Hourly Chart
Technical traders can take heart though, as price action for the past 2 days appears to be confined within a rising Channel. However, it should be noted that the number of touch points for this Channel is rather limited, and hence the relevance of this Channel is suspect as well. Nonetheless, if prices do respect this Channel, then the next immediate move would be towards Channel Top after the rebound off Channel Bottom. Stochastic indicator agrees as Stoch curve is reversing now and we could be seeing a bullish cycle emerging even though readings did not reach Oversold to begin with.
Daily Chart
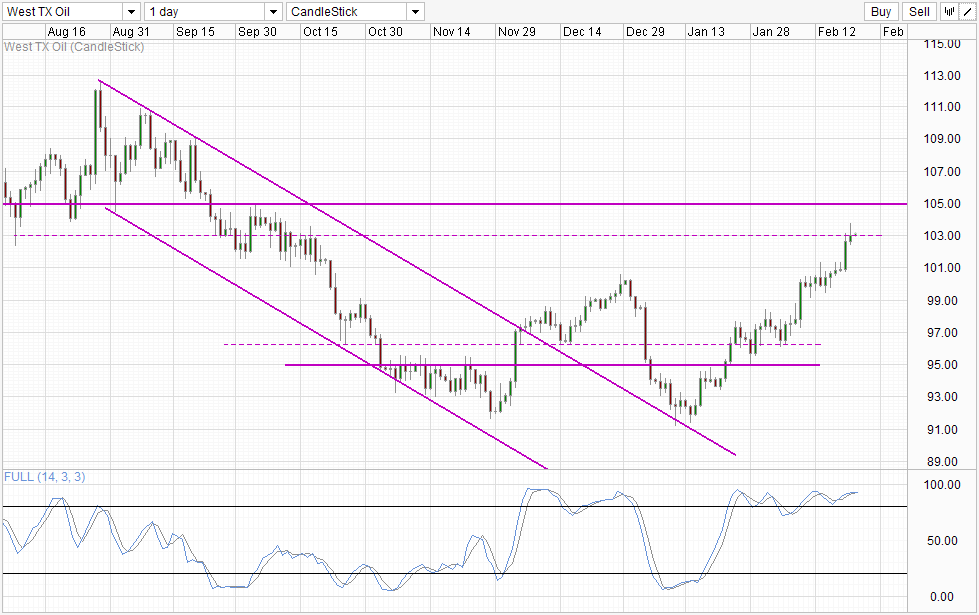
From the Daily Chart, we can see prices trading breaking the 103.0 resistance. This is not entirely surprising as we did mention that 103.0 level is "soft" as it is only the mid point of the consolidation zone found in Oct 2013. Stronger resistance can be found at 105.0, which lend support to short-term technicals which favor continued rallies if the rising Channel remains in play.
The key question right now is should traders participate in this rally. This is a hard one to make, as both S/T and L/T chart point to upside potential, and trend traders should be able to make this trade without much fuss. However, given the lack of clarity in markets right now it may be an understatement to say that entering into a long position when current rally has not seen any significant pullback is risky. Hence traders will need to weigh and see if trading right now is worth the risk.


