Sometimes market just behave beyond your expectations.
Yesterday it was mentioned that DOE Crude Inventories may not provide true directional movements, but merely add fuel to the volatility bonfire between 103.0 – 104.5, and we’ve got that grossly wrong. The latest numbers from DOE was extremely bearish, showing an increase of 6.8M when analysts were expecting a 0.9M gain. Furthermore, there seem to be structural issue with supply/demand balance in WTI Crude, with this week’s numbers continuing last week’s dismal implied demand, suggesting that this week’s numbers can’t be regarded as a one off outlier. 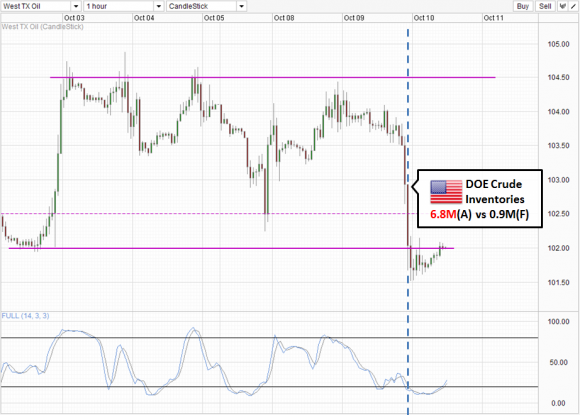
Hence it is no wonder that prices fell close to $2.50 a a barrel on a D/D basis. However, it should be noted that prices were already bearish before the DOE numbers were released, and there is a strong likelihood that bears simply made use of this opportunity to sell aggressively, breaking 102.5 and 102.0 support lines in the process.
From a technical perspective, it is not surprising to see prices acting bearishly during early US session as pressure has always been towards the downside due to the failure of price to test 104.5 during the rally 2 days ago. Hence, a retest of 103.5 was always possible given the broad “risk off” sentiment with all the issues surrounding US Debt Ceiling and Government Budget right now. By breaking 103.5, quick acceleration was always a high possibility with price moving towards 103.0 and subsequently 102.5 when the former has been broken. The only true surprise was that the DOE numbers came at the best possible time for the bears, and hence even 102.0 support buckled. However based on current price action, there seem to be a chance that prices may be retaking 102.0 once more, affirming our previous assertion that a sideways movement in the short-term was always favored. 
Weekly Chart disagree with the sideways outlook though, as the breach of 103.0 and the break of the rising trendline intersection impairs the bull trend that has been in play since April lows. This is in line with what Stochastic indicator has been telling us with Stoch curve continuing pointing lower and is currently below the 40.0 “support” level – suggesting that bearish momentum from August highs is still in play with 98.0 – 100.0 support zone as target.
That being said, considering the volatility in WTI, there is a chance that this break of 103.0 may not be “real”, and further confirmation should be sought to eliminate fakeouts. Nonetheless it is good to see prices trading below last Wed’s level where prices rallied due to the expected completion of the TransCanada Corp pipeline. By trading below this level, we can assume that market has fully digested and discounted the additional pipeline news, and with no more pipelines coming up, we have no more bullish drivers in the next few months that will be unique to WTI only. This would mean WTI will track global oil prices better and be driven by global economic rise and fall in the months to come.
Original post
- English (UK)
- English (India)
- English (Canada)
- English (Australia)
- English (South Africa)
- English (Philippines)
- English (Nigeria)
- Deutsch
- Español (España)
- Español (México)
- Français
- Italiano
- Nederlands
- Português (Portugal)
- Polski
- Português (Brasil)
- Русский
- Türkçe
- العربية
- Ελληνικά
- Svenska
- Suomi
- עברית
- 日本語
- 한국어
- 简体中文
- 繁體中文
- Bahasa Indonesia
- Bahasa Melayu
- ไทย
- Tiếng Việt
- हिंदी
WTI Crude: 103 Broken, More Confirmation Needed
Published 10/10/2013, 10:57 AM
Updated 07/09/2023, 06:31 AM
WTI Crude: 103 Broken, More Confirmation Needed
Latest comments
Loading next article…
Install Our App
Risk Disclosure: Trading in financial instruments and/or cryptocurrencies involves high risks including the risk of losing some, or all, of your investment amount, and may not be suitable for all investors. Prices of cryptocurrencies are extremely volatile and may be affected by external factors such as financial, regulatory or political events. Trading on margin increases the financial risks.
Before deciding to trade in financial instrument or cryptocurrencies you should be fully informed of the risks and costs associated with trading the financial markets, carefully consider your investment objectives, level of experience, and risk appetite, and seek professional advice where needed.
Fusion Media would like to remind you that the data contained in this website is not necessarily real-time nor accurate. The data and prices on the website are not necessarily provided by any market or exchange, but may be provided by market makers, and so prices may not be accurate and may differ from the actual price at any given market, meaning prices are indicative and not appropriate for trading purposes. Fusion Media and any provider of the data contained in this website will not accept liability for any loss or damage as a result of your trading, or your reliance on the information contained within this website.
It is prohibited to use, store, reproduce, display, modify, transmit or distribute the data contained in this website without the explicit prior written permission of Fusion Media and/or the data provider. All intellectual property rights are reserved by the providers and/or the exchange providing the data contained in this website.
Fusion Media may be compensated by the advertisers that appear on the website, based on your interaction with the advertisements or advertisers.
© 2007-2024 - Fusion Media Limited. All Rights Reserved.