Oil prices gained on Friday despite weaker than expected US Non-Farm Payroll numbers. This rally was spurred on due to the ongoing Libyan crisis where rebels have been holding control over 2 oil exporting ports for the past 8 months, with traders/speculators expecting the deal between Government officials and rebels to fall through. However, to the surprise of many, the deal did actually occur over the weekend, with the Government currently gaining control over Zueitina and Hariga terminals in the east. On top of that, 2 other ports are expected to open in the next few weeks, which will restore Libyan's oil export that has fallen to 20% of its former levels due to the export blockade.
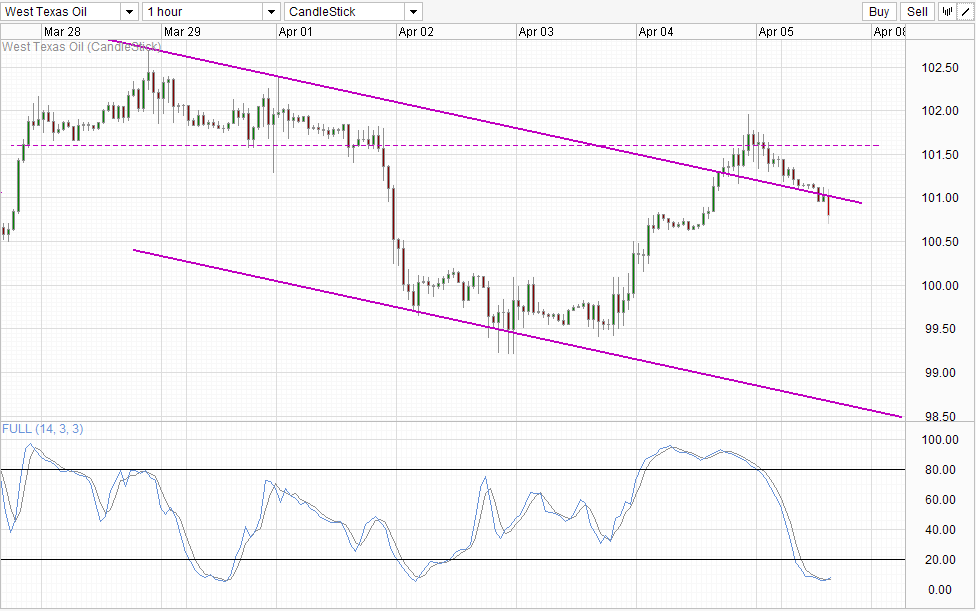
Hourly Chart
Strangely, we did not see a huge chunk of price reversal, with WTI prices continuing the pace of moderate decline from last Friday's peak. We are now trading below the 101.0 round figure and pushing below the descending trendline which opens up a potential move towards Channel Bottom. The fact that prices were unable to stay above 101.6 soft resistance or break above 102.0 can be interpreted as a confirmation for the bearish trend that has been in place since the start of last Monday, increasing the likelihood of prices moving towards Channel Bottom.
However, the relevance of the newly drawn Channel is suspect, and without trading below the 100.5 support it is still possible that current decline may simply be a corrective move off Thursday's rally. This is because the pace of decline is much more muted than expected, suggesting that bullish support remains strong - perhaps an indication that speculators not fully buying into the Libya story yet. Furthermore, Stochastic indicator is deeply Oversold, increasing the likelihood of 100.5 support holding and suggest that a push towards 101.0 and higher may even be possible. It will also not be surprising if prices fail to tag 100.5 before reversing seeing as there is a consolidation zone between 100.6 - 100.7 seen on Friday which will provide support against any declines in the immediate future.
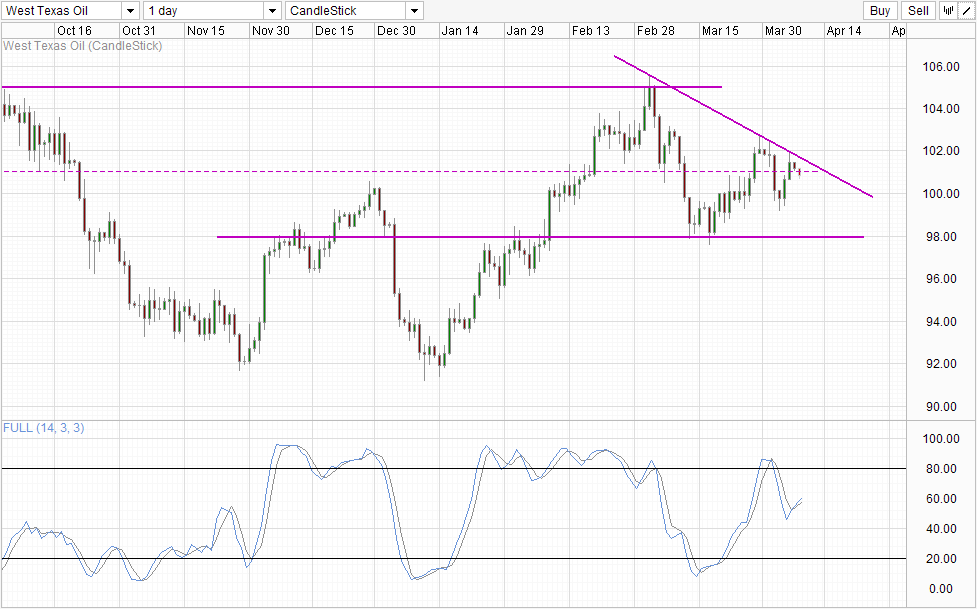
Daily Chart

Direction on the Daily Chart appears to be bearish if we look from the high of March. Based on this perspective, prices is trending lower with 98.0 as the next bearish target with 100.0 as interim support. However, if we take the perspective from Jan lows or even Nov lows, uptrend remains strong and recent sell-off is merely corrective in nature. If this perspective is correct, then the likelihood of 100.0 support becomes higher and we could see a rebound back up towards 102.0 from the century mark and a move towards 105+ will not be out of the question.
Fundamentals favor weaker prices though as demand for Crude is not expected to grow significantly looking at recent soft manufacturing data. With US output expected to increase further in 2014 - 2015, it is clear that direction of WTI should be lower. Couple this with the continued inaccessibility of Cushing oil will worsen the oversupply glut, resulting in even weaker prices. The only thing going for WTI right now is the possibility of overestimation of US oil reserves that has recently came to light. If that is indeed true, then the supply outlook for WTI will need to be changed. But even in such a scenario, the demand issue remains unresolved and as such there will be limited growth potential in prices.

