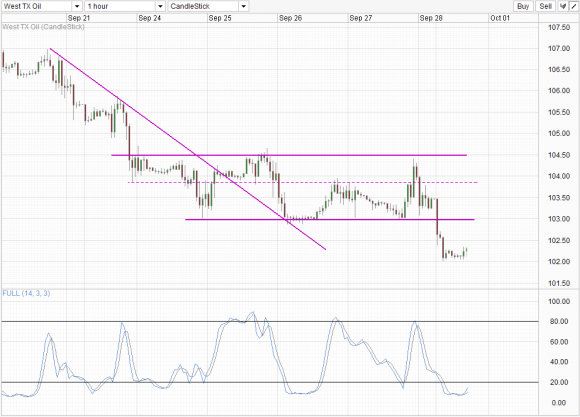
Crude oil tanked during early Asian session due to the US debt ceiling scare, shedding more than 1.4% within the first 3 hours of trade this morning. However, the price appeared to have stabilized, and is evident via the lack of bearish response even though HSBC/Markit Chinese Manufacturing PMI (final) came in much lower than initial flash estimates, clocking in at 50.2 vs the 51.2 earlier print. This is a tremendous bearish development which drove risk appetite in Asian market lower, with the Hang Seng Index and Nikkei 225 both trading lower.
Hourly Chart
This lack of bearish response suggest that current bearish momentum may have stalled, and a short-term bottom may be in place. This increases the likelihood of 102.0 holding and opens up the possibility of prices pushing back towards the 103.0 support turned resistance. Stochastic readings agree, as readings are highly oversold and are pointing higher currently. Currently the bullish cycle signal is still not yet formed, and prices may need to clear the 102.5 soft resistance in order to have a clearer bullish mandate towards 103.0. It is also likely that Stoch readings will be above 20.0 should that happen, adding bullish conviction.
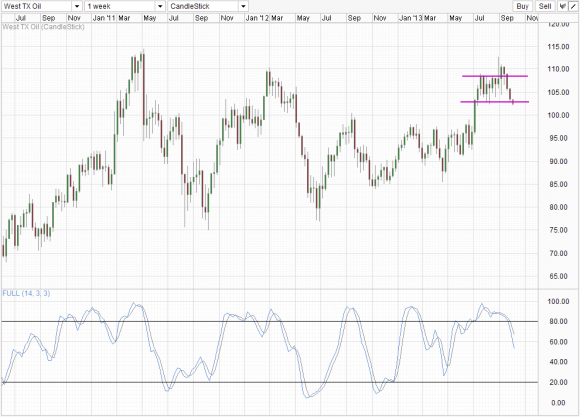
Weekly Chart
However, as long as the price stays below 103.0, the long-term bearish bias will remain. Currently, the bearish cycle appears to be in mid flight, with a 3 Black Crow candlestick pattern weighing. This opens up a bearish target of 98.0 and we could potentially see quick bearish acceleration if the 103.0 break is confirmed. Ironically, the current short-term bullish correction may just be the long-term bearish confirmation needed if prices fail the 103.0 test. But should short-term bullish pressure succeed, we could see the long-term bias shift higher, with a 108.5 – 110.0 ceiling in sight.
Original post
- English (UK)
- English (India)
- English (Canada)
- English (Australia)
- English (South Africa)
- English (Philippines)
- English (Nigeria)
- Deutsch
- Español (España)
- Español (México)
- Français
- Italiano
- Nederlands
- Português (Portugal)
- Polski
- Português (Brasil)
- Русский
- Türkçe
- العربية
- Ελληνικά
- Svenska
- Suomi
- עברית
- 日本語
- 한국어
- 简体中文
- 繁體中文
- Bahasa Indonesia
- Bahasa Melayu
- ไทย
- Tiếng Việt
- हिंदी
WTI Crude Lower But Support Remains Above 102.0
Published 09/30/2013, 06:32 AM
Updated 07/09/2023, 06:31 AM
WTI Crude Lower But Support Remains Above 102.0
3rd party Ad. Not an offer or recommendation by Investing.com. See disclosure here or
remove ads
.
Latest comments
Install Our App
Risk Disclosure: Trading in financial instruments and/or cryptocurrencies involves high risks including the risk of losing some, or all, of your investment amount, and may not be suitable for all investors. Prices of cryptocurrencies are extremely volatile and may be affected by external factors such as financial, regulatory or political events. Trading on margin increases the financial risks.
Before deciding to trade in financial instrument or cryptocurrencies you should be fully informed of the risks and costs associated with trading the financial markets, carefully consider your investment objectives, level of experience, and risk appetite, and seek professional advice where needed.
Fusion Media would like to remind you that the data contained in this website is not necessarily real-time nor accurate. The data and prices on the website are not necessarily provided by any market or exchange, but may be provided by market makers, and so prices may not be accurate and may differ from the actual price at any given market, meaning prices are indicative and not appropriate for trading purposes. Fusion Media and any provider of the data contained in this website will not accept liability for any loss or damage as a result of your trading, or your reliance on the information contained within this website.
It is prohibited to use, store, reproduce, display, modify, transmit or distribute the data contained in this website without the explicit prior written permission of Fusion Media and/or the data provider. All intellectual property rights are reserved by the providers and/or the exchange providing the data contained in this website.
Fusion Media may be compensated by the advertisers that appear on the website, based on your interaction with the advertisements or advertisers.
© 2007-2024 - Fusion Media Limited. All Rights Reserved.

