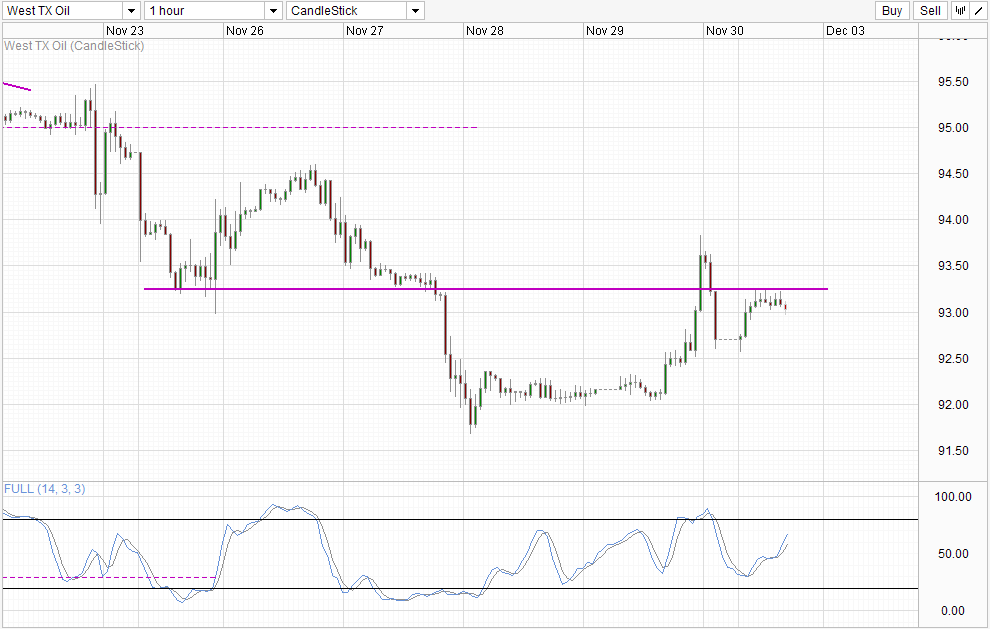
Hourly Chart
Crude Oil prices received a boost this morning due to the China Manufacturing PMI numbers that were released over the weekend. The latest official PMI numbers have beaten analysts estimates, suggesting that the fears of a continued slowdown in China may be over-exaggerated. Fears that the official numbers are "too optimistic" were unfounded as the private surveys done by HSBC/Markit managed to beat estimates as well. However, the pace of growth is slightly lower compared to the previous month, unlike the official figures which matched October's numbers, which does take the shine off this bullish print.
This may be part of the reason why prices remained below the 93.25 resistance even though risk appetite was strong during Asian hours. Failure to breach 93.25 opens up a move back towards 92.0+ levels, and currently price is testing 93.0 round figure (and soft support), with bearish acceleration expected should the level be broken.
Stochastic readings suggest that bullish momentum isn't fully over with the Stoch curve still a fair distance beneath the Overbought region. However, given that previous peaks have been seen around 70.0, it will not be too surprising if the Stoch curve reverses lower from here and adds as a confirmation for the bearish push towards 92.0.
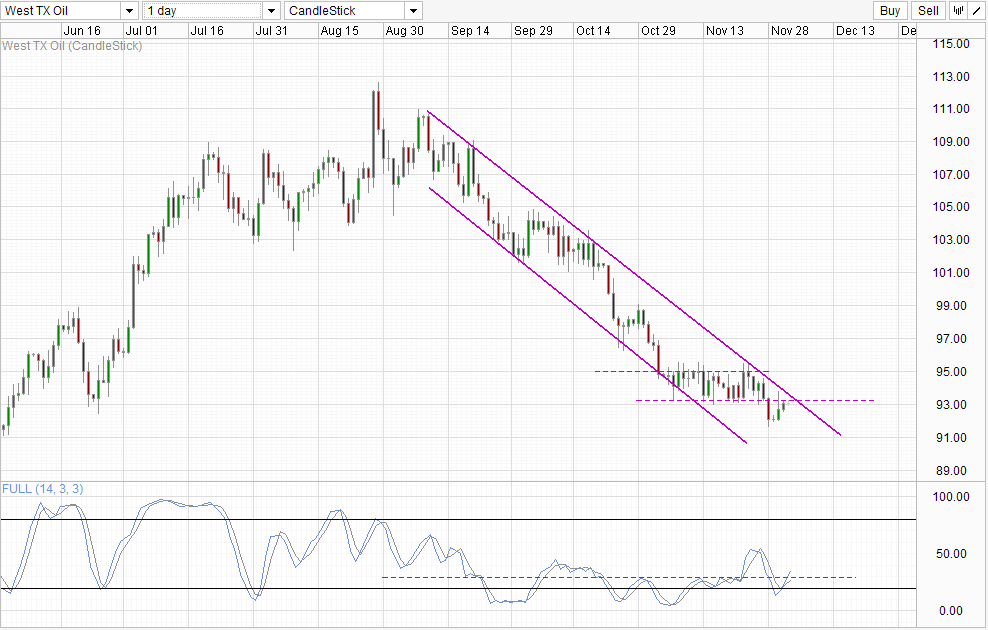
Daily Chart
The Daily Chart supports the bearish outlook, with prices facing not just the 93.25 resistance but also additional bearish pressure from the descending Channel Top. However, unlike the Short-Term chart where a bearish move is already visible, there is no evidence that bullish momentum (or the bullish recovery from 29th November) is over. Stochastics agree with the Stoch curve actually pushing above the "resistance" of 30.0. Nonetheless, overall bearish pressure is immense, and the Stoch curve will need to clear above the 50.0 level before true bullish momentum can be considered. Similarly, even if price manages to push above the Channel Top, ideally price will need to clear above 95.0 resistance before long-term bullish correction can be contemplated.
This notion is also supported by Fundamentals. Production from the US continues increasing and the country is expected to take over the title of world's largest producer by the end of 2015. The recent Nuclear Agreement with Iran has also cooled the turmoil in the Middle East, resulting in less speculative play in Oil due to fear. With global demand falling (as evident by the slowdown in OPEC production - in order to keep prices lifted), WTI Crude prices are expected to continue falling in 2013 and well into 2014.
That doesn't give carte blanche to bears though. Keep in mind that from a long-term perspective the recovery momentum is still in play. Furthermore, it seems that bulls are not going down without putting up a fight - see the sudden rise in WTI prices last Friday which was not triggered by any fundamental news release. Hence traders should certainly be wary and not automatically assume that it will be a smooth journey south from here.
Original post
- English (UK)
- English (India)
- English (Canada)
- English (Australia)
- English (South Africa)
- English (Philippines)
- English (Nigeria)
- Deutsch
- Español (España)
- Español (México)
- Français
- Italiano
- Nederlands
- Português (Portugal)
- Polski
- Português (Brasil)
- Русский
- Türkçe
- العربية
- Ελληνικά
- Svenska
- Suomi
- עברית
- 日本語
- 한국어
- 简体中文
- 繁體中文
- Bahasa Indonesia
- Bahasa Melayu
- ไทย
- Tiếng Việt
- हिंदी
WTI Crude Bearish Below 93.25
Published 12/02/2013, 06:06 AM
Updated 07/09/2023, 06:31 AM
WTI Crude Bearish Below 93.25
3rd party Ad. Not an offer or recommendation by Investing.com. See disclosure here or
remove ads
.
Latest comments
Install Our App
Risk Disclosure: Trading in financial instruments and/or cryptocurrencies involves high risks including the risk of losing some, or all, of your investment amount, and may not be suitable for all investors. Prices of cryptocurrencies are extremely volatile and may be affected by external factors such as financial, regulatory or political events. Trading on margin increases the financial risks.
Before deciding to trade in financial instrument or cryptocurrencies you should be fully informed of the risks and costs associated with trading the financial markets, carefully consider your investment objectives, level of experience, and risk appetite, and seek professional advice where needed.
Fusion Media would like to remind you that the data contained in this website is not necessarily real-time nor accurate. The data and prices on the website are not necessarily provided by any market or exchange, but may be provided by market makers, and so prices may not be accurate and may differ from the actual price at any given market, meaning prices are indicative and not appropriate for trading purposes. Fusion Media and any provider of the data contained in this website will not accept liability for any loss or damage as a result of your trading, or your reliance on the information contained within this website.
It is prohibited to use, store, reproduce, display, modify, transmit or distribute the data contained in this website without the explicit prior written permission of Fusion Media and/or the data provider. All intellectual property rights are reserved by the providers and/or the exchange providing the data contained in this website.
Fusion Media may be compensated by the advertisers that appear on the website, based on your interaction with the advertisements or advertisers.
© 2007-2024 - Fusion Media Limited. All Rights Reserved.