Oil continues it’s bearish consolidation, while precious metals await this weekend’s French election.
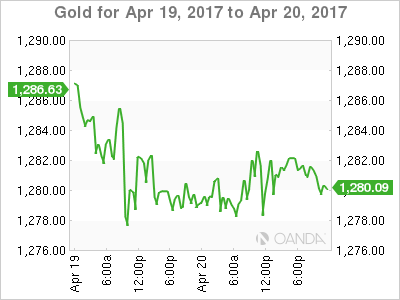
Gold has spent the overnight session consolidating to open quietly mid-range at 1281 this morning in Asia. The fact that gold is almost unchanged from its open of the previous day suggests that traders are now positioned and in a wait and see mode ahead of this weekend’s French presidential voting.
From a chart perspective, however, gold appears to have run out of momentum, having made a series of lower highs over the past few days. Assuming the weekend passes without surprises election wise, there is potential for a correction on Monday as safe-haven hedges are lightened. However, a surprise win by both the extreme left and right candidates could make gold’s price action when it opens early Monday emotional, to say the least.
Key levels for the Asian session and into the weekend are supports at 1270 and 1260 with resistance at 1296, 1300 and 1308.

Silver
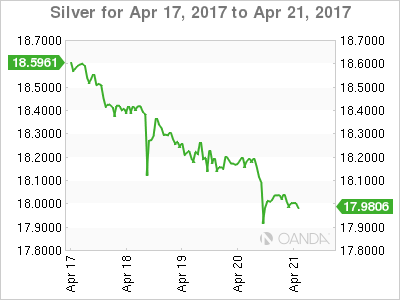
Silver meanwhile, it looking even less constructive on the charts. Since peaking on Monday at 18.6550, silver has made a series of lower daily highs and lows and is now perched precariously on its 200-day moving average at 18.0200. Clearly, this weekend’s vote in France will set the price agenda into the next week, but like gold, its price action is not constructive from a technical perspective.
For Thursday's session, silver has support at 17.8650 initially and then 17.7400. Resistance lies at 18.2400 with a close above implying a move back to the 18.5000 area.

Oil
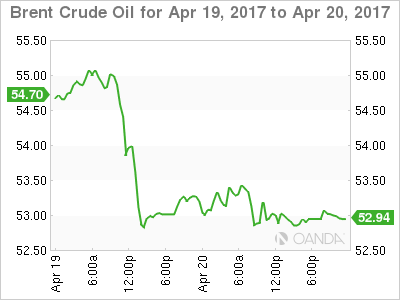
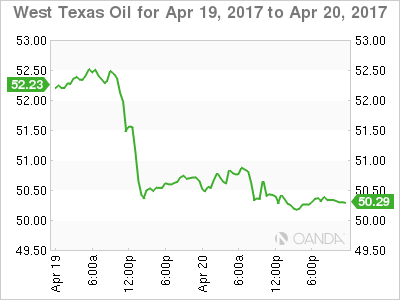
Crude has consolidated near the bottom of its recent ranges as Asian trading gets under way. After the midweek clean out of long positioning, traders appear averse to initiating fresh longs as the Street frets about record oil inventories globally and rising U.S. production.
From a technical perspective, neither Brent nor WTI’s price action is constructive. Instead, both seem to be making bearish consolidation patterns before another move to the downside.
Brent spot has clearly defined support at 52.50 with resistance at 53.50 intraday.
WTI spot has support at 50.00 with resistance at 51.00 intraday.
The price action over the last 48 hours, suggests a break of the support levels in both, could trigger more stop-loss selling as optimism meets reality.


Summary
Were it not for the French election this weekend; commodities would not be looking constructive technically. However with “Le Crunch” this Sunday, surprises cannot be ruled out, and they have the potential to override the technical picture. Some more short-term consolidation cannot be ruled out over Thursday's session, but traders should be watching their news feeds late Sunday, and the metals open at 6 am Singapore for further clues.
