There are “dots” appearing in economic releases confirming a growth cycle, and one particularly interesting “dot” because it is not sending strong signals on growth.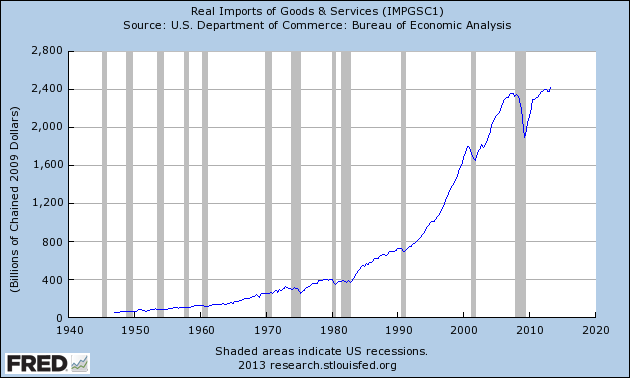
Imports have been historically a good indicator of economic growth – growing in non-recessionary periods, with the growth stalling or contracting during recessions. Now look at the flat growth since the beginning of 2012. But it looks like imports have decided to grow again beginning in 2013.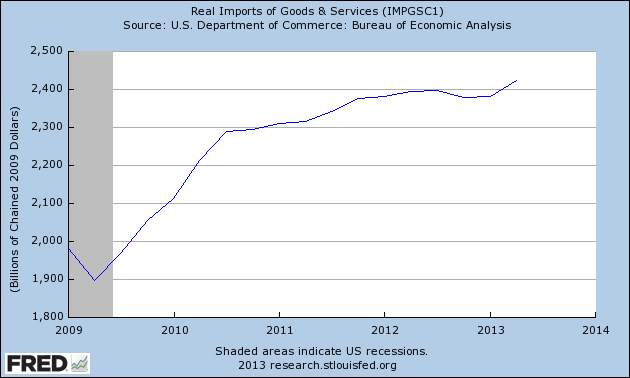
One headwind in imports can be attributed to a decline in the value of oil imports (all the following charts are from the BEA).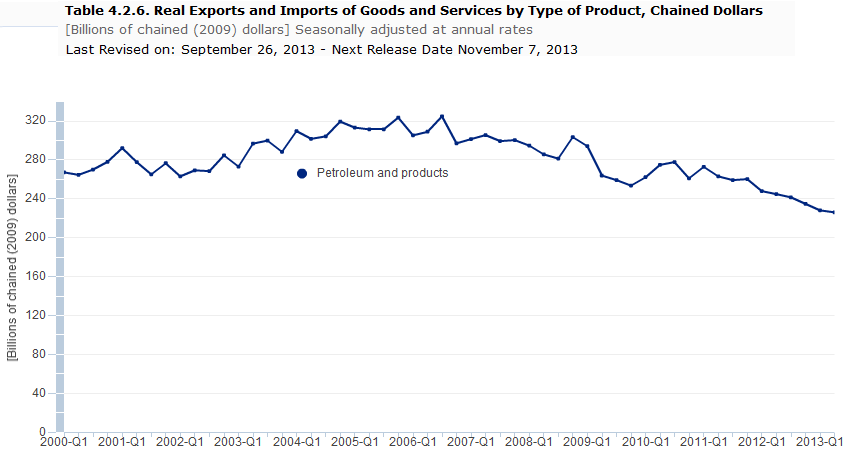
But the other elements of imports show an almost an almost imperceptible growth – but growth none-the-less.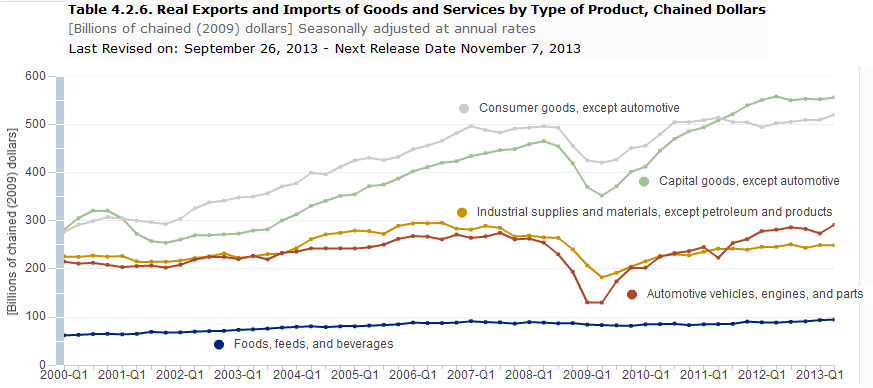
Although most elements of imports have returned to their pre-recession levels – over the last couple of years they are showing an economy only marginally expanding. Two of the import elements (industrial supplies and capital goods) are forwarding looking elements – and they appear flatter than a pancake. Typically a forward looking element would be an imported item which is used in the domestic manufacturing cycle.
The cutoff in the BEA data (used in the graphs above) is through 2Q2013 so this data is lagging. We also have monthly data from US Census on trade – now updated through August (which is one month less lagging). Here we have a continued degradation in imports – and there is very little growth year-over-year.
Inflation Adjusted Year-over-Year Change Goods Export (blue line), Goods Import less Oil (red line), and Goods Import with Oil (yellow line)
For a more coincident look at imports, container counts have a reasonable correlation to non-petroleum imports – and whilst the import data has improved in 3Q2013, it is not a significant improvement.
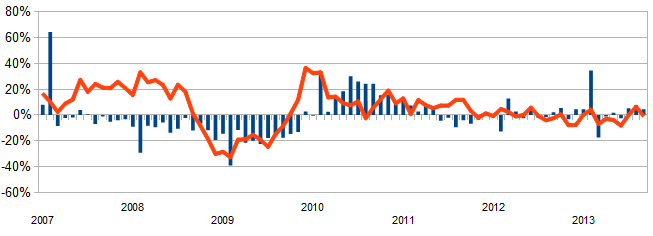
Unadjusted Year-over-Year Change in Container Counts – Ports of Los Angeles and Long Beach Combined – Imports (red line) and Exports (blue bars)
To sum it up, my view is that the economy rate of growth may be improving – but it is the difference between a slow snail and a fast snail. There is little sign that the economy is taking off – and we can only wonder if the Fed will ever stop Quantitative Easing. Even though they have transparently advised the basic elements which they are watching, you must suspect the process to end QE is very subjective and not as objective as portrayed.
And this time the economy just does not want to signal it is clear of the recessionary black hole as it has done after past recessions.
Other Economic News this Week:
The Econintersect economic forecast for October 2013 again improved and it appears an improving cycle has begun. There is no indication the cycle is particularly strong, as our concern remains that consumers are spending a historically high amount of their income, and the rate of gain on the points we watch are not very strong.
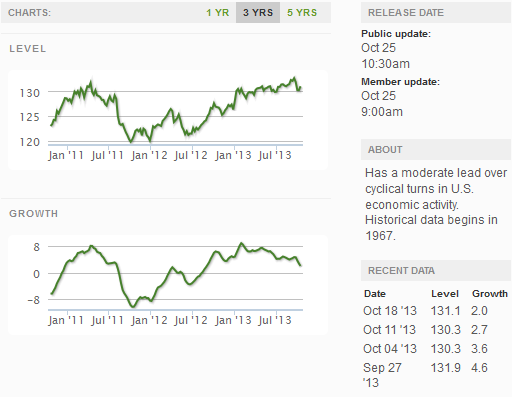
The ECRI WLI growth index value has been weakly in positive territory for over four months – but in a noticeable improvement trend. The index is indicating the economy six month from today will be slightly better than it is today.
Current ECRI WLI Growth Index
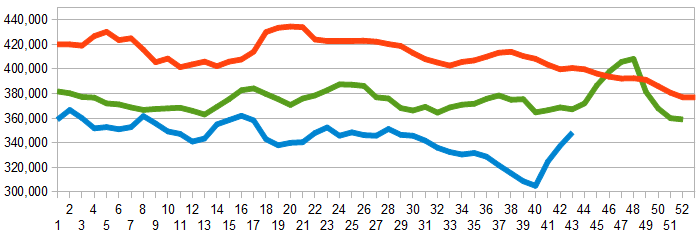
Initial unemployment claims went from 358,000 (reported last week) to 350,000 this week. Historically, claims exceeding 400,000 per week usually occur when employment gains are less than the workforce growth, resulting in an increasing unemployment rate.
The real gauge – the 4 week moving average – degraded from 336,500 (reported last week) to 348,250. Because of the noise (week-to-week movements from abnormal events AND the backward revisions to previous weeks releases), the 4-week average remains the reliable gauge.
Weekly Initial Unemployment Claims – 4 Week Average – Seasonally Adjusted – 2011 (red line), 2012 (green line), 2013 (blue line)
Bankruptcies this Week: Molecular Testing
Data released this week which contained economically intuitive components(forward looking) were:
- Rail movements growth trend is continuing to accelerate.
All other data released this week either does not have enough historical correlation to the economy to be considered intuitive, or is simply a coincident indicator to the economy.
Weekly Economic Release Scorecard:
Click here to view the scorecard table below with active hyperlinks


