
Price Analysis For XRP: March 4
On Feb 24, a flash crash caused a rapid drop in XRP’s price. The following day, XRP was listed on Coinbase Pro. It quickly regained much of its lost value.
Shortly thereafter, controversy followed. Accusations of insider trading began circulating on the internet. On Mar 1, an article in Forbes called XRP a pump and dump scheme.
The value of XRP is now trading near the lows experienced on Feb 24 before the Coinbase listing. It appears as if an upward trend may be emerging. Whether or not XRP will survive these developing controversies, however, is unknown.
Key Highlights for March 4
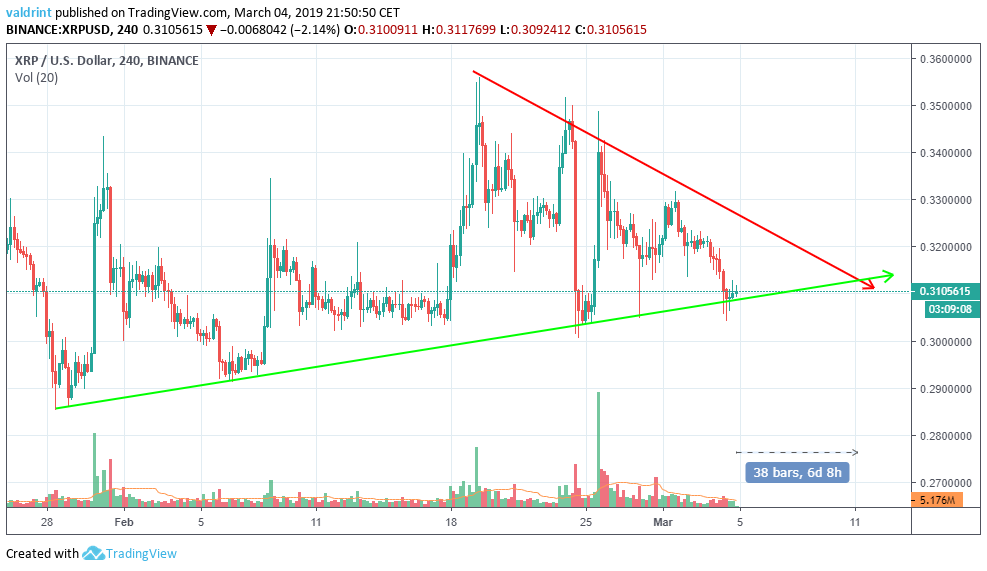
- Price has been trading inside a symmetrical triangle.
- There is major support near $0.29.
- There is major resistance near $0.34.
Is it time for Ripple to rebound or will controversy cause catastrophe for the cryptocurrency?
The Start of The Drop
The price of XRP on Binance was analyzed on two-hour intervals between Jan 28 and Mar 5.
A high of over $0.35 was reached on Feb 19. A gradual drop followed. A slight recovery saw a second high reached on Feb 24.
A flash crash followed. XRP lost over 10% of its value. A quick recovery saw a third high attained on Feb 26.
Resistance and Support
Tracing the highest reach on Feb 19, 24, and 26 generates the descending resistance line. At $0.31, XRP is currently trading below this resistance. Prices appear to be decreasing at a faster rate than predicted by these three descending highs.
The ascending support line is created by inverting the method used to generate the descending resistance line. Instead of examing descending highs, ascending lows are examined between Jan 28 and the present.
The number of times the line is touched and its validity have a positive correlation. This pattern is projected to end in roughly 6 days when a breakout/breakdown is likely to occur.
A Look at the RSI
The relative strength index (RSI) is an indicator which calculates the size of the changes in price in order to determine oversold or overbought conditions in the market. It ranges from 0-100, values >70 indicating overbought conditions and
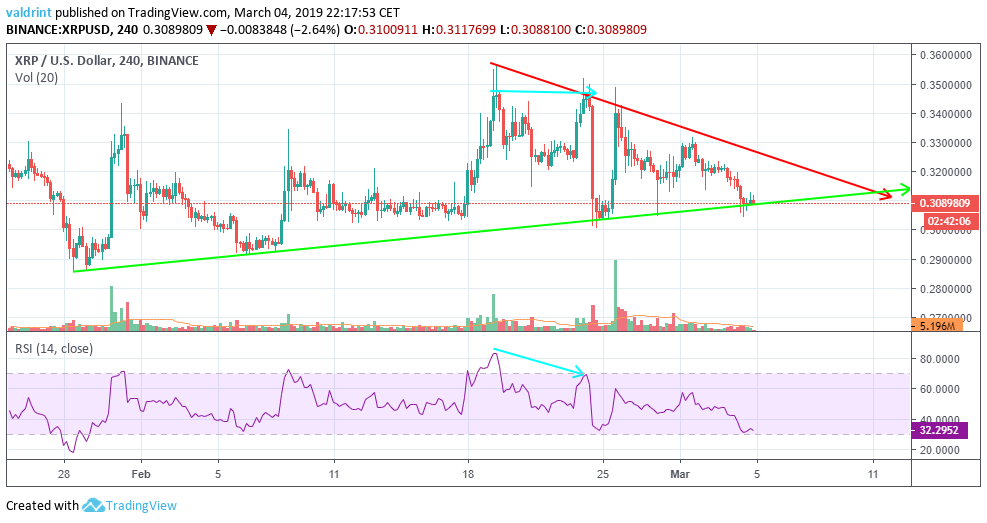
While price reached the top at $0.34 twice, on Feb 18 and Feb 26, the RSI did not. We can see that the top on Feb 26 had an RSI level of 70, compared to 86 on the Feb 18 top. This is called a bearish divergence and often precedes drops in price.
After the Breakout/Breakdown
Resistance and support areas are found when the price reaches a certain level several times. Resistance acts as a floor while support acts as the ceiling. Together they build a structure which is supposed to limit the scope of the price.
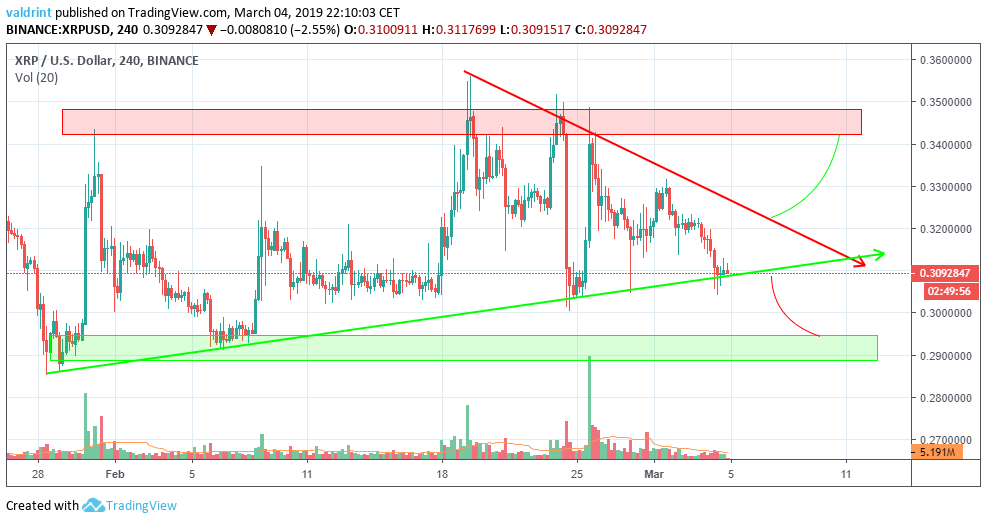
In the image above, the areas outlined may be helpful in predicting likely price stops. Such stops often occur when a breakout from a pattern takes place.
Combining RSI bullish/bearish divergence with a support/resistance effectively predicts price fluctuations. The resistance lines are then used to predict where the price is likely headed. Support and resistance areas are used after the breakout/breakdown materializes in order to predict possible areas for a reversal.
Given the above information, XRP may trade inside the triangle for the next six days, before breaking down and heading to the support area near $0.29.
Images courtesy of TradingView, Shutterstock.
Disclaimer: This article is not trading advice and should not be construed as such. Always consult a trained financial professional before investing in cryptocurrencies, as the market is particularly volatile.