
Dogecoin (DOGE) was listed on the Vertbase exchange on Mar 5, 2019. It can be purchased where it can be bought using the United States Dollar (USD, $).
As Dogecoin continues being listed on new exchanges, the coin appears to grow stronger. But will this new listing be able to help DOGE leap to the moon?
Key Highlights For March 8
- The price reached a high of $0.00218 on Feb 24.
- A flash crash dropped it to $0.00191 on Feb 27.
- Price is trading inside a horizontal channel.
- Volume has been higher on bearish candles.
- The MACD and SMAs have triggered a sell signal.
- There is resistance near $0.00219.
- There is support near $0.00182.
Tracing Resistance
The price of Dogecoin on Hitbtc is analyzed at one-hour intervals from Feb 24 to Mar 8.
The price reached a high of $0.00218 on Feb 24. A flash crash dropped it to $0.00191. A rebound took it back to $0.002061 on Feb 25.
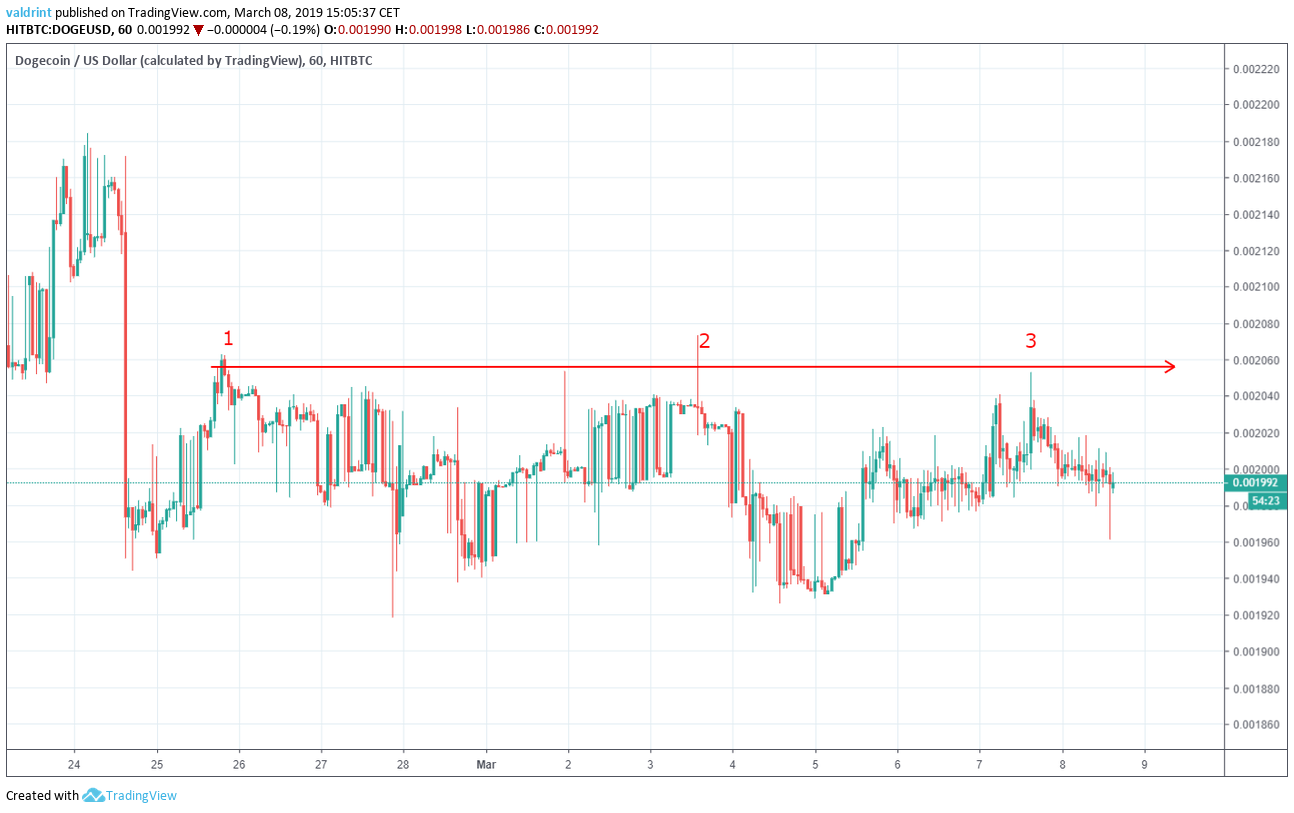
Tracing these highs gives us the horizontal resistance line. The dates in which the line was touched are:
- Feb 25
- Mar 3
- Mar 8
The resistance line can effectively act as a ceiling to price, preventing further upward movement. However, a breakout above it could trigger a rapid price increases. With current price decreases below the support, such a breakout does not appear likely in the short term.
Horizontal Channel
After the Feb 25 high, the price made a low of $0.00192. It revisited the same level four times. Tracing these lines gives us the horizontal support line.
 The dates in which the line was touched are:
- Feb 27
- Feb 28
- Mar 4
- Mar 5
The support line can act as a floor to price, preventing further downward movement.
The support and horizontal lines combined give us the parallel horizontal channel, which is a neutral pattern, making a price increase and decrease equally likely.
If the price trades outside of this channel for an extended period of time, new support and resistance lines may develop. DOGE is currently trading nearly in the middle of the channel.
While recent price drops may continue and bring the coin closer to the support, recovery might be impending. This would cause price rises that could bring DOGE closer to the resistance. It is not expected that DOGE will trade outside of this range in the foreseeable future.
Signal Triggered
The moving average convergence divergence (MACD) is a trend indicator that shows the relationship between two moving averages (long and short-term) and the price. It is used to measure the strength of a move.
Combined with simple moving averages (SMA), MACD can be used as a trigger for buy and sell signals. Signals are triggered whenever the MACD line is above 0 and the price is above the 21 (red) and 50-period (green) SMAs.
Volume is a measure of how much of a certain asset is traded in a certain period of time. Combined with the MACD, it can be used as a confirmation tool for the beginning of a trend.
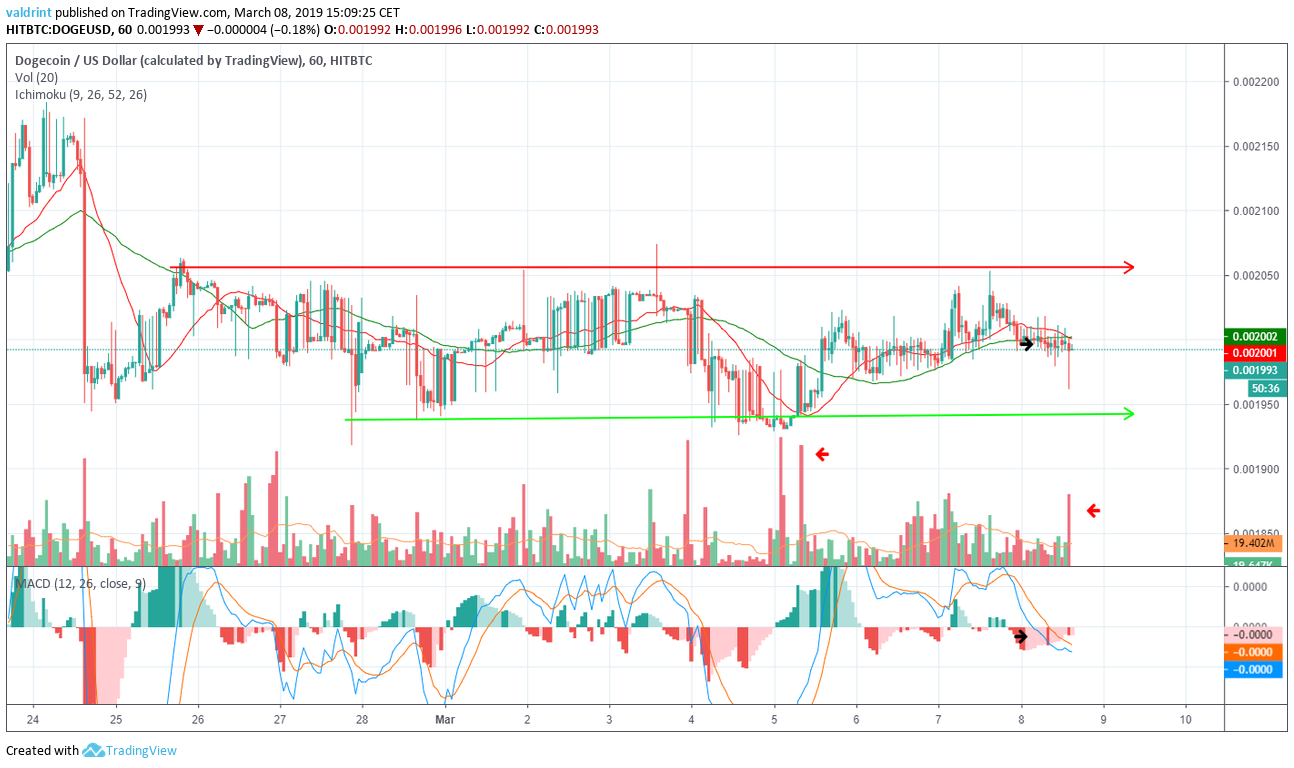
On Mar 8, the price moved below the 21 and 50-period moving averages. At the same time, the MACD line moved below 0.
This would effectively trigger a sell signal, indicating that the current downtrend may continue or even worsen. Drops below the support still are not expected.
Furthermore, the volume on bearish candles was higher than on bullish ones, giving further confirmation to the signal triggered by the MACD and the moving averages.
This signal would be invalidated by a price movement above the SMAs and a MACD line movement above 0.
Future Movements
To better determine possible future price movements, DOGE is analyzed on six-hour intervals from Jan 14 to Mar 8.
Resistance and support areas are formed when the price reaches a certain level several times. They can act as a ceiling/floor that prevents the price from moving further in that direction.
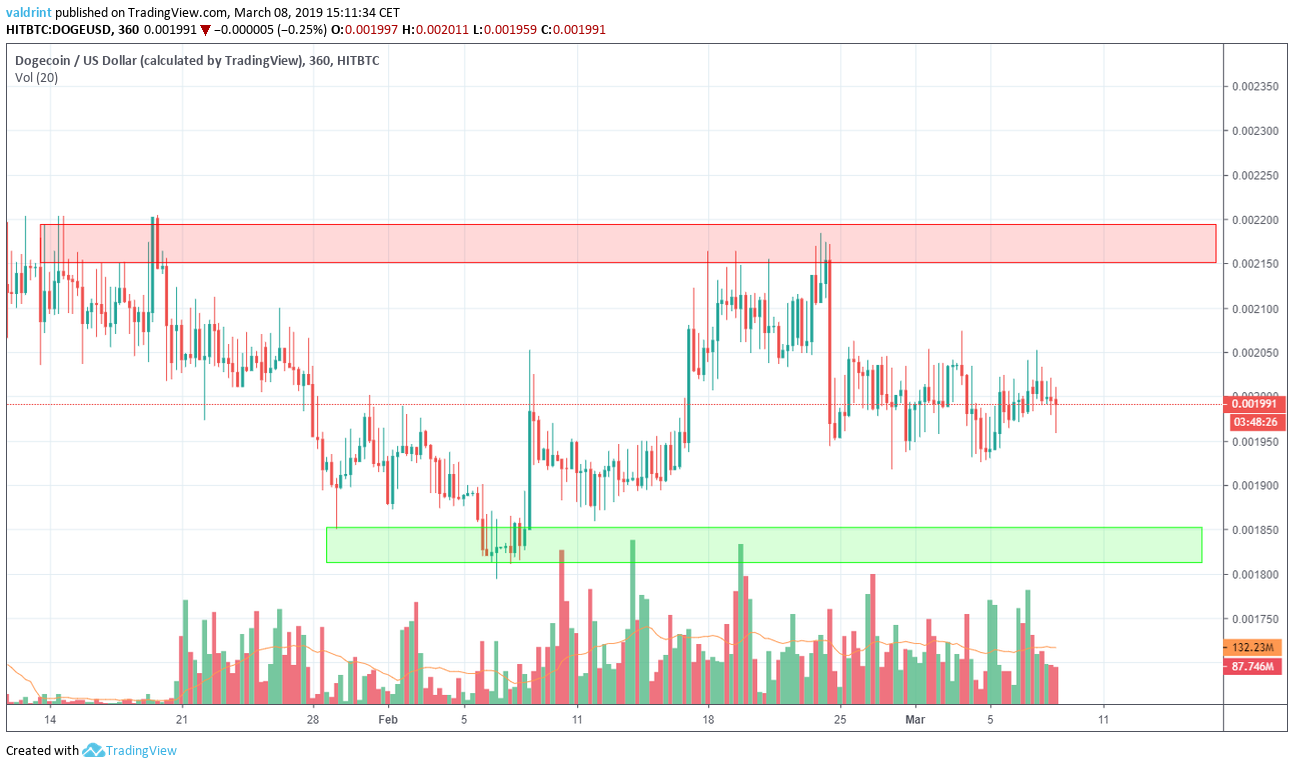 There is a resistance area near $0.00219. In case the price breaks out of the horizontal channel, this would present a likely area of reversal.
There is support near $0.00182. In case the price breaks down from the horizontal channel, this would present a likely area of reversal.
Based on this analysis, the price of DOGE is likely to decrease in value in a movement toward the support. It is unlikely that the drop will bring DOGE below the support. On the contrary, after a new low is reached within the channel, rises will likely bring DOGE closer to the resistance.
If the price drops but then rises before reaching support, the prediction would be fully validated. Price drops below the support line would indicate partial validation. A sudden rise would invalidate these projections.