Get 40% Off
🚨 Volatile Markets? Find Hidden Gems for Serious Outperformance
Find Stocks Now

Why Volatility Suggests Further Equity Weakness May Be In Store

Published 04/24/2020, 01:16 PM
Updated 07/09/2023, 06:31 AM

There’s been a tremendous amount of discussion among traders and market commentators about the classification of the current trend in equities. Specifically, whether we are in a counter-trend rally (a dead cat bounce) or in the early stages of a new up trend after the March low. As I often do, I turn to volatility to get insight into what’s developing in the financial markets.

Last Sunday I wrote that I believed we were/are in a counter-trend rally within a longer-term bear market. Part of my reason for this is based on the lack of decline in volatility. This will cause many to stop and shout, “But the VIX has fallen from 83 to under 40!” And you’d be right. But I think we must evaluate the path volatility has taken from the viewpoint of its one-year percentile, i.e. where is it within its one-year range. Specifically – has its current decline been similar to prior bear market bottoms or counter-trend rallies?

I last wrote about a persistently elevated VIX on March 5, noting that when we see VIX stay at an above-average level, historically we don’t see an immediate bounce in stocks – but instead experience further downside in price. During severe and protracted declines and bear markets, we historically see the VIX stay above roughly the 30 percentile of its one-year range. I’ll be taking a look at last two major bear markets as examples as well as the decline in late-2018.

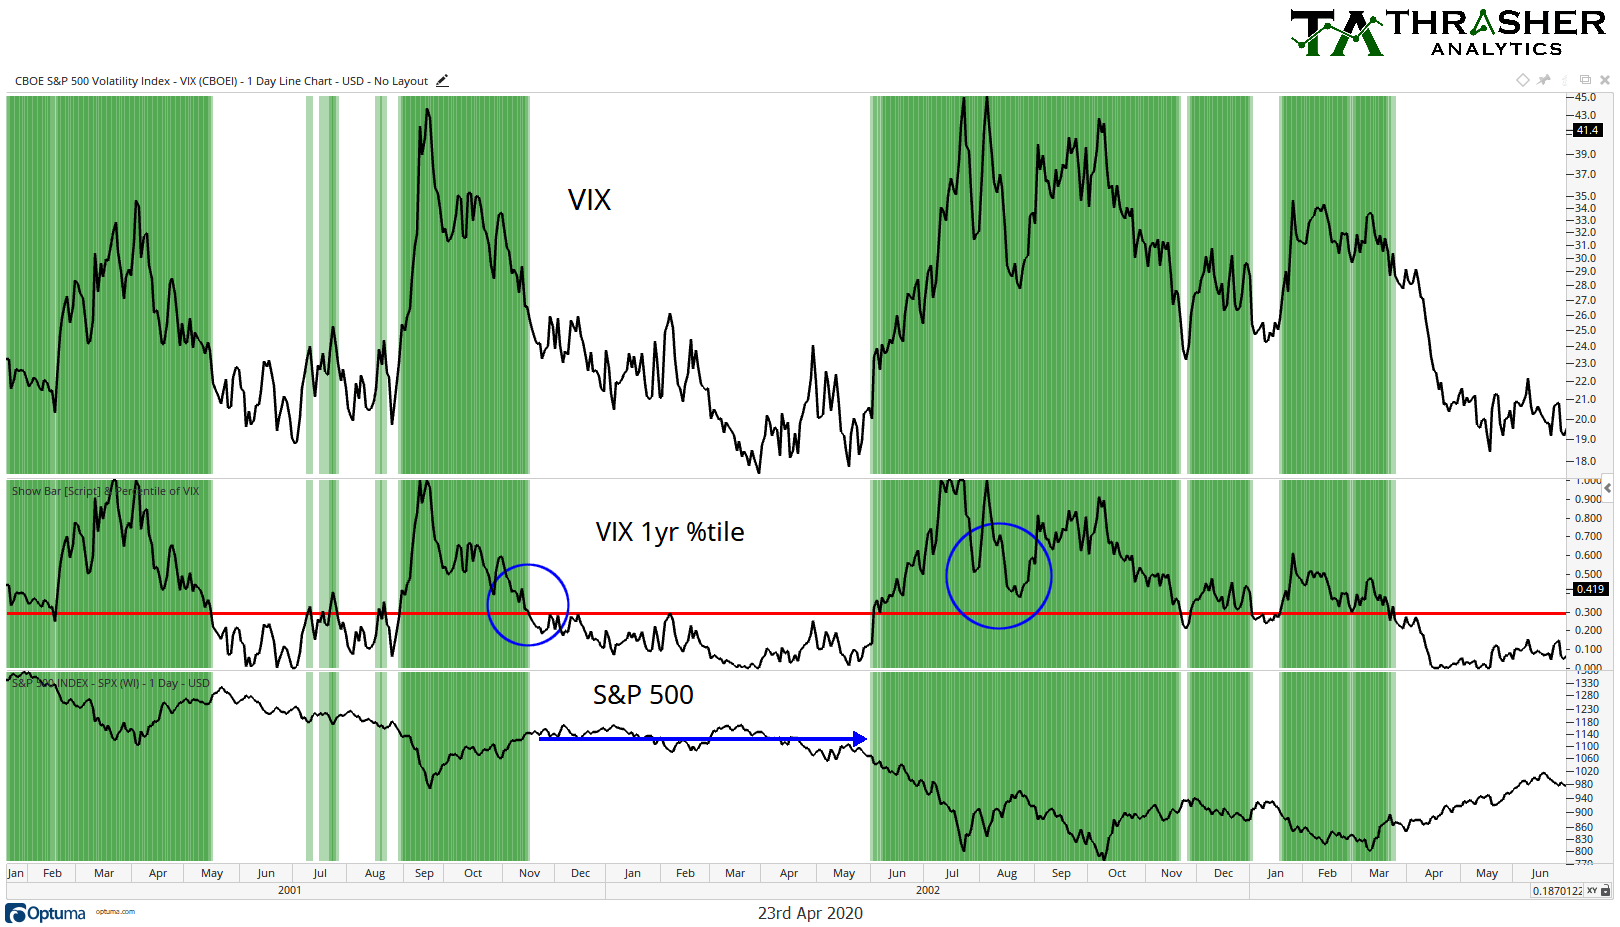
Let’s start with the bear market that resulted from the dot-com bubble. Things didn’t start really moving until late 2001 when we dropped 20% within three months, a similar (albeit not as fast) decline as we have seen today. The VIX fell below its 30-percentile in November and the S&P 500 basically flatlined for seven months. Then, equities started moving materially lower and volatility started rising again. During the next bounce in stocks, what we now know as a ‘dead cat bounce’ in mid-2002, VIX never got to its 30percentile. Instead, volatility stayed elevated, which stocks then responded to by making a new low, eventually bottoming out.

3rd party Ad. Not an offer or recommendation by Investing.com. See disclosure here or remove ads .

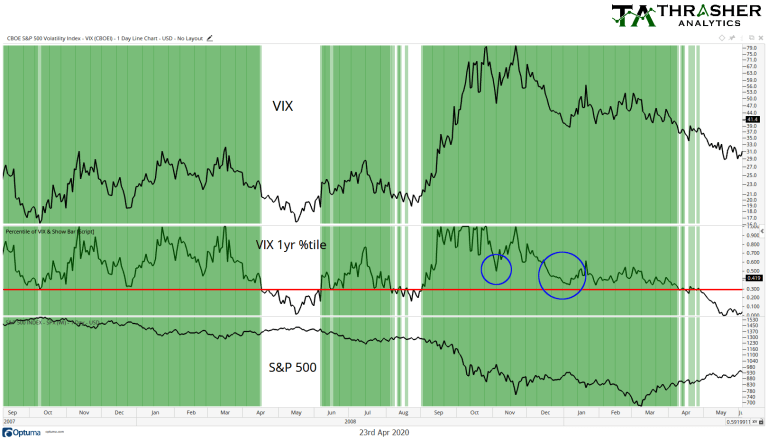
Next, we had the Great Financial Crisis in 2008. Stocks began a fairly slow and orderly decline in early 2008 and the real fireworks didn’t kick off until October, again, when we saw a 20% decline over a three-month period. SPX saw some large counter-trend rallies, from 15% to nearly 25%, before the final March ’09 low. During that time, we never saw the VIX break its 30 percentile until April, after equities had bottomed.

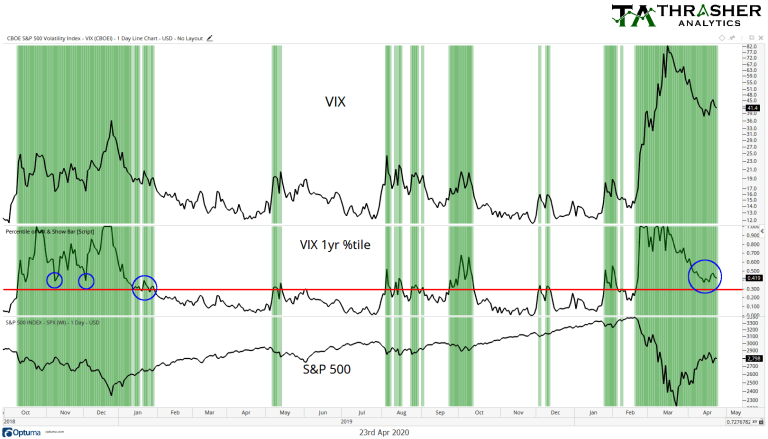
Finally, we have today. First, notice on the left side of the chart that shows the Q4 ’18 decline. During the two brief bounces in equities we also didn’t see the 30 percentile of the VIX break. We could look at the corrections in 2011 and 1998, too. They also had counter-trend rallies that were marked with elevated volatility until the final low in SPX was formed. Today, we have the one-year percentile for the Volatility Index at 0.41, even though the VIX has been cut in half.

By using the percentile of volatility, we can better evaluate its move higher and put the corresponding price action of the large-cap equity index in context. These historical examples are some of the reasons why I believe we haven’t finished seeing downside price action in stocks just yet. However, if we see the VIX continue to move lower as well as several other criteria I’ve laid out in my Thrasher Analytics letter be met then I’ll gladly shift my bias and begin looking for further upside in equities . It’s important to keep an open mind and adapt to the changing price action.

3rd party Ad. Not an offer or recommendation by Investing.com. See disclosure here or remove ads .

Disclaimer: Do not construe anything written in this post or this blog in its entirety as a recommendation, research, or an offer to buy or sell any securities. Everything in this post is meant for educational and entertainment purposes only.

Latest comments

Leveraged money managers disagree. A better gauge is the VIX and S&P 500 futures. Leverages money is net short the VIX and net long the 500 futures.
leveraged managers are often wrong.. I am short equities.. target 220ü
Stop fighting the market and losing money. We will only break when everyone belives this is over. Then when everyone is selling we will explode to new highs
It appears that institutional money that moved the market up for for years after the bottom in 2009 are at it again. There were weak earnings for years but still the market rose. Low interest rates, liquidity rule. Nothing else matters. God help those who try to fade a market that goes up continuously on bad news and poor fundamentals. Buy theNasdaq 100 and buy the SPY and enjoy your gains . There are plenty of dead stocks from the crisis but own the quality and growth with strong balance sheets.
I think we just have to wait and see if the 50% retracement line stays beat we are clearly in the middle of what looks like a rising wedge if the dow beats 25k and stays there above 61.8% the feds plan worked if not we are in for a ride to the bottom. Pretty much no inbetween any more.
Lets see if earnings this week show us anything and gdp results. Still could be weeks or months before this whole thing finds its way
The amount of experts and their concise expertise in the comments section is staggering. Great, informative article though, thank you.
Since when reality or volatility started to matter to markets? The market reality is Fed has our backs now and economic reality will catch in a few years until then we can go nowhere but up. Keeps the poiticians happy and wealth effect going. Other than there is nothing in the market nothing. It's nothing burger that should be trading at 50-60% lower than where it sits now and still it will be overvalued if measured using reality.
Very good article. Easy to understand but still very instructive. Thank you.
I'm assuming that also means the 30% slightly changes on a daily basis since the one year range changes every day?
wait, forget that. I misunderstood what you meant. it only changes if a new high or low is reached.
what price is the 30% line?
clearly there's resistance at around 2880 ish.
wow, so simple, watch vix and invest at bottom.... u can write better i am sure
volatility is useless to analyze the market, it simply reflects the probability of loss that permanent capital does not reflect risk
Risk Disclosure: Trading in financial instruments and/or cryptocurrencies involves high risks including the risk of losing some, or all, of your investment amount, and may not be suitable for all investors. Prices of cryptocurrencies are extremely volatile and may be affected by external factors such as financial, regulatory or political events. Trading on margin increases the financial risks.
Before deciding to trade in financial instrument or cryptocurrencies you should be fully informed of the risks and costs associated with trading the financial markets, carefully consider your investment objectives, level of experience, and risk appetite, and seek professional advice where needed.
Fusion Media would like to remind you that the data contained in this website is not necessarily real-time nor accurate. The data and prices on the website are not necessarily provided by any market or exchange, but may be provided by market makers, and so prices may not be accurate and may differ from the actual price at any given market, meaning prices are indicative and not appropriate for trading purposes. Fusion Media and any provider of the data contained in this website will not accept liability for any loss or damage as a result of your trading, or your reliance on the information contained within this website.
It is prohibited to use, store, reproduce, display, modify, transmit or distribute the data contained in this website without the explicit prior written permission of Fusion Media and/or the data provider. All intellectual property rights are reserved by the providers and/or the exchange providing the data contained in this website.
Fusion Media may be compensated by the advertisers that appear on the website, based on your interaction with the advertisements or advertisers.
© 2007-2024 - Fusion Media Limited. All Rights Reserved.