Oil rallied through a 9 straight day from $42 to $47 showing no chance of correction, yet the day has come as yesterday it dropped to a 5 day low to $44.6 before correcting and rising again. But why did oil fall more than 3% in one day?
Technical Analysis was already in an overbought market
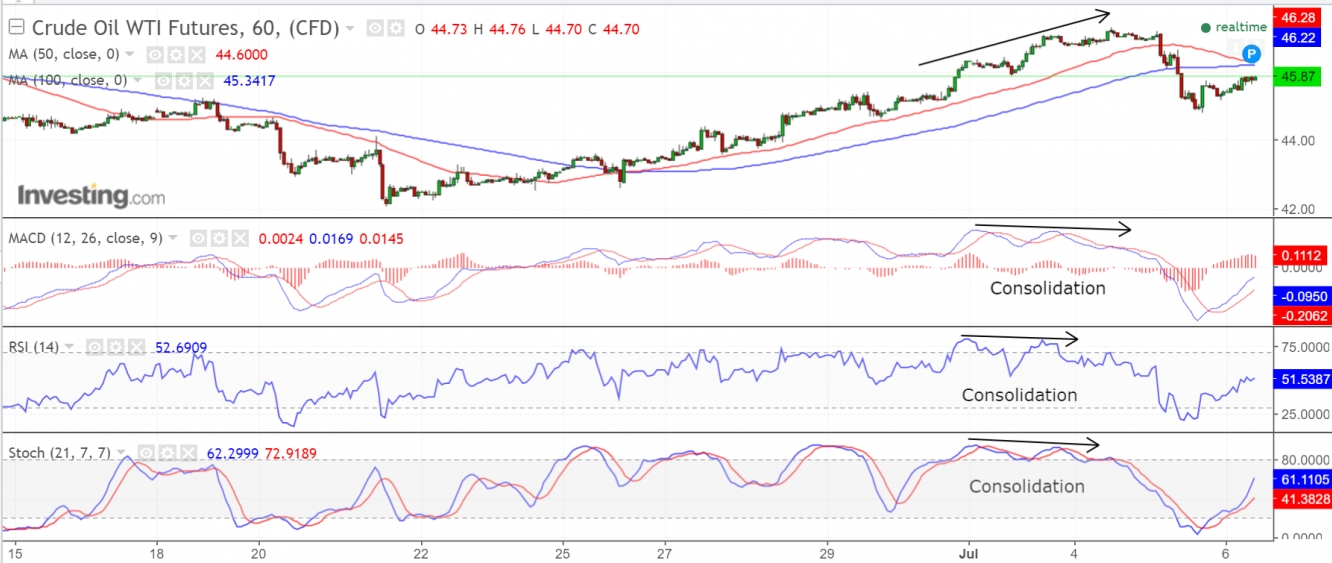
On a 1H and 4H chart oil indicators were already in an overbought zone and consolidating, which sent a message to most traders including me that a downfall was near.
Risky traders kept buying in an overbought market, however most experts who saw a close downfall, closed there active contracts, and was just waiting for the perfect time to start selling.
On the other hand according to ECB Group, although market was still rising, volumes started to decrease, which confirmed a saturated market.
No one was paying attention to Inventory Data
Last week crude stock was forecasted to drop 2.6M and Inventories 2.585M, yet both of them rose 0.851M & 0.118M respectably. Yet traders paid more attention to the biggest drop on oil production since last year (see “Oil Rises 9% In A Week”).
Traders paid even more attention to BH Rig Count which fell for the first time since January and boosted oil prices on Friday before closing markets.
So we can say that Fundamental Traders were still in a bullish trend while technical were actually viewing a saturated market. It was just waiting the perfect moment to start acting.
Reversal Pattern Finally Showed Out
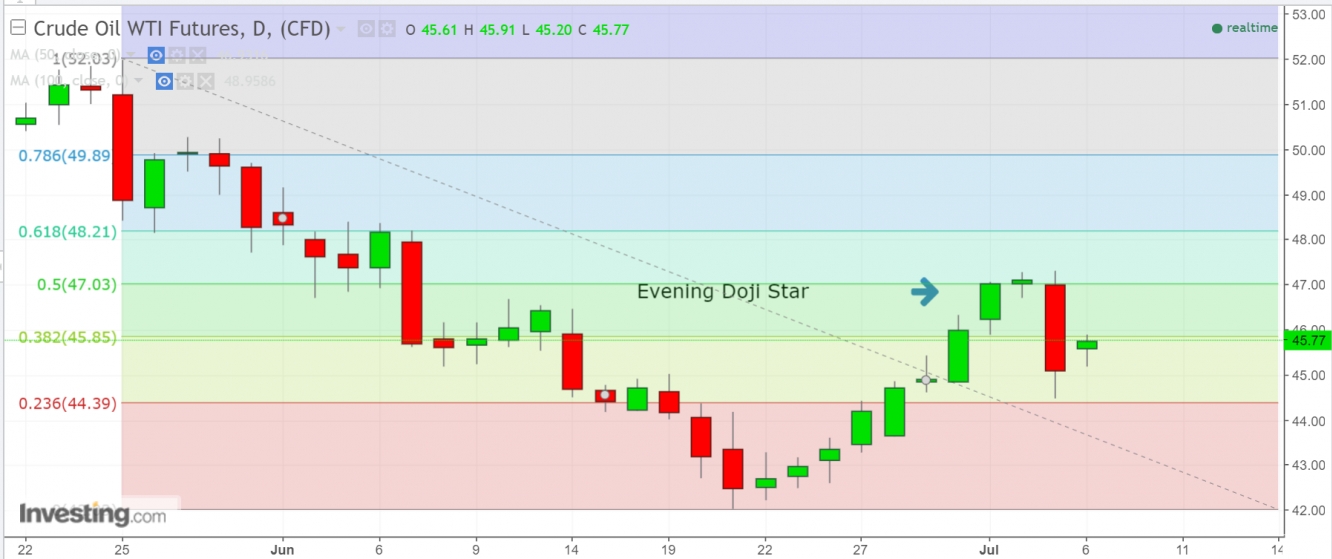
On July 3 oil prices touched 50% Fibonacci retracement and the next day failed to raise further and retreated to practically the same closing price the day before. This accompanied with previous analysis (North Korea Ballistic Test & Russia disagreeing with a further production cut) were the perfect fit for traders to start selling as market showed that no interest in raising to next Fibonacci Retracement.
API Crude Oil Stock Saved the Day
Traders had no sentiment in stop selling if is not for the API Crude Oil Stock which showed a decline of 5.6M ahead of a 1.6M forecast. Yesterday traders did pay attention to API data in order to slow massive oil decline and managed to recover a bit.
If data showed a further raise on stock data, it would probably keep failing to a 6-7 day low. However this was very hard to achieve as last week production fell to a year low.
What to Expect?
Traders have all eyes on oil inventories released today, if it’s consistent with yesterday’s API data, we may see a further recover on oil.
We need to be cautious if price touches $47 again, if price is passed then next target will be $48.21, but if it reverses, we may see a double top pattern followed by a further decline.


