One way to verify rosy official data--GDP growth, low unemployment, etc.--is to compare it with data that is less easily gamed: for example, energy consumption. Those seeking a realistic snapshot of the Chinese economy routinely turn to energy consumption and rail traffic data for this reason: at least until recently, these data sets were more reflective of real economic activity than the glowing official numbers.
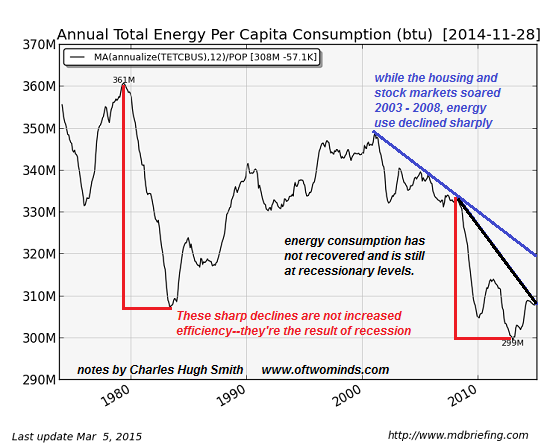
So let's try the same analysis on the U.S. economy. Courtesy of Market Daily Briefing, here are four charts of per capita (per person) energy consumption. By using per capita data, we eliminate population growth as a variable. If total energy consumption remains steady as population rises, the per capita energy consumption will drop.
As vehicles, appliances, etc. become more energy-efficient, we would expect per capita energy consumption to decline. For example, as mileage/unit of fuel of vehicles rise, the fuel needed to drive the same number of miles per year declines.
offsetting this gradual decline due to increasing efficiency is an overall rise in the standard of living, which in a consumerist society means owning and operating more vehicles, appliances, etc., taking more vacations, etc.--all of which tend to push per capita energy consumption higher.
Increasing efficiency is a long-term trend. The sharp drops in the charts below characterize the effects of recession on consumption: as economic activity plummets, per capita energy consumption plummets, too.
We can see this in the first chart of total per capita energy consumption: energy use plummeted sharply in the 1980-82 recession, and then recovered along with economic activity. The sharp drop in consumption in the 2008-09 recession was not followed by robust recovery.
Per capita energy consumption has remained at recessionary levels.
Just as striking is the decline registered during the housing/stock bubble years of strong GDP growth 2002-2008: the economy was growing like gang-busters in these years, why did energy consumption drop so significantly? Did vehicles, appliances, etc. get that much more efficient? Or does this reflect a less-than robust real economy?
Per capita transportation consumption is even more at odds with official rosy data.Given record-breaking vehicle sales and strong GDP growth, we'd expect to see equivalent strength in transportation consumption. Instead, consumption continuing dropping during the "recovery" and remains at recessionary levels. 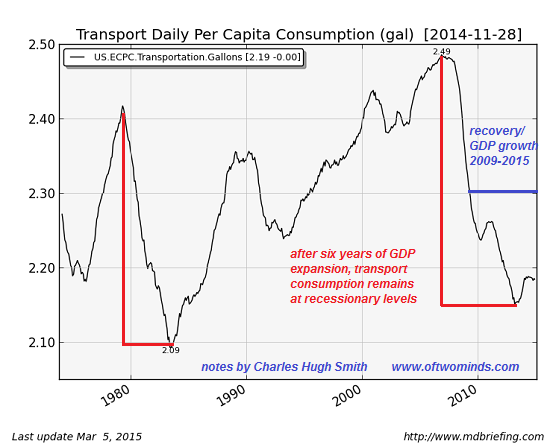
Per capita residential consumption has bounced back, but remains well below 2007 levels after hitting multi-decade lows in the middle of the current "recovery."What really pops out of this chart is the dramatic secular decline in per capita residential consumption since the peak reached in the early 2000s. 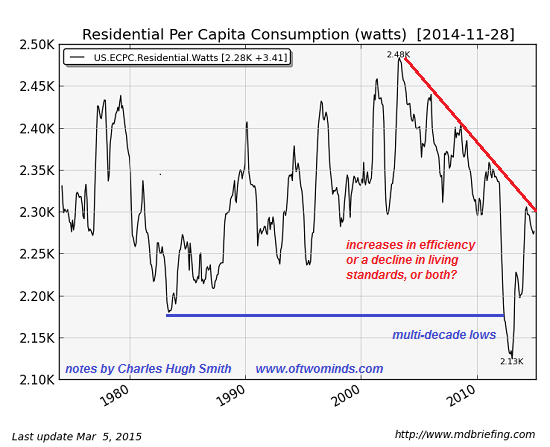
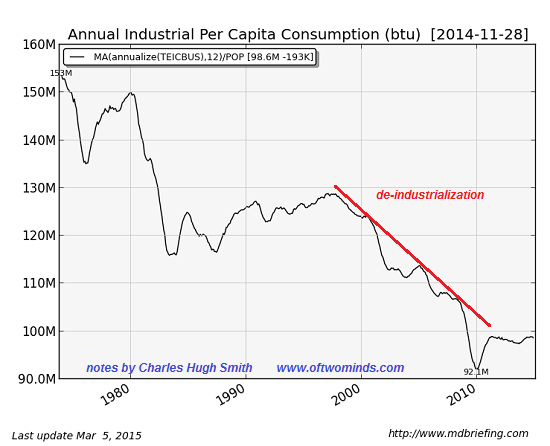
The decline in per capita industrial consumption is not unexpected, given the mass offshoring of industrial production. While there are multiple factors at work here, it is difficult not to discern a trajectory of de-industrialization in this chart.
Courtesy of Doug Short, here is a chart of per capita vehicle sales. Once again we see a long-term secular decline in the number of vehicles sold per person from the peak over 30 years ago.
That vehicles last longer nowadays is a positive contributor to this trend, but it is noteworthy that vehicle sales per capita slid even in the go-go boom of the 2000s.
The current rise off the bottom in 2009 is suspect because so many of these sales result from subprime auto loans, cash for clunkers and various incentive programs. That the current level is still significantly below per capita sales in 1999 and 2006 after six years of GDP growth suggests that the current "recovery" is different from previous post-recession recoveries. 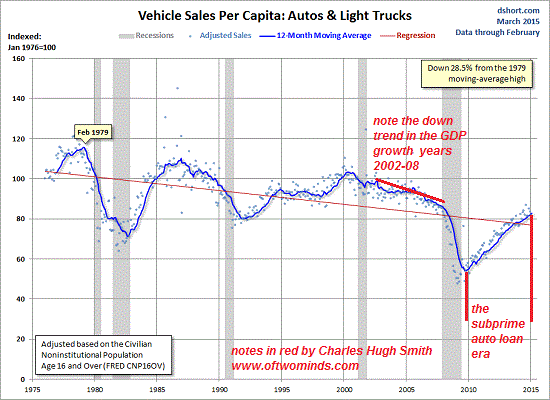
There are other factors at work here, of course--as the population ages, total miles driven tends to decline, the stagnation of income and the rising costs of auto ownership have led to a generational loss of interest in vehicle ownership, the boom in urban living has led many to abandon vehicle ownership in favor of car-sharing and public transport, etc.
But if we combine these data series, we get a picture not of robust growth akin to previous post-recession periods, but a "recovery" that by previous standards remains recession-bound.
