Gold was a star performer during the month of August, outshining other assets in an impressive rally which took many investors by surprise. Many analysts attributed gold’s strength to investors’ expectations of another monetary rescue operation from the Federal Reserve. But as we’ll see in this commentary, such an action is unnecessary to gold’s continued strength.
After a vigorous rally last week, gold investors adopted a cautious tone ahead of Friday’s annual gathering of central bankers and finance ministers at Jackson Hole, Wyoming. During the 2-day meeting, hopes of another quantitative easing (QE) program were disappointed disappointed due to the recent spate of positive economic and consumer spending reports. But this doesn’t mean gold won’t be able to benefit from the other economic variables in the mixing pot. Let’s take a look at some of these variables.
A weak dollar helped propel gold’s breakout in August. In recent days, the story behind gold’s rise and the dollar’s weakness has been investors’ expectation of a third quantitative easing (QE) program in the near future, which would benefit the yellow metal and hurt the greenback. A more likely explanation is that savvy investors see more trouble on the horizon from still unsolved euro zone debt crisis. These investors are taking advantage of gold’s historical “oversold” technical signal from earlier this summer and have been heavily accumulating gold as a safe haven investment.
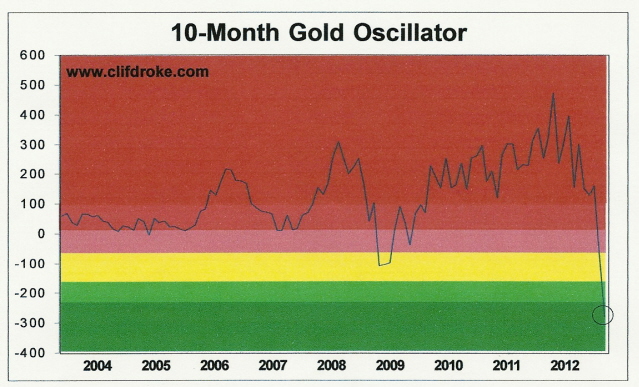
As a reminder of how oversold gold had become on a longer-term basis I bring to your attention once again the following graph showing the 10-month price oscillator for gold:
As discussed in previous commentaries, anytime this important indicator reaches an “oversold” reading it has always represents an excellent buy signal for gold from an intermediate-term to longer-term standpoint. The indicator has once again proved its merit following gold’s latest breakout and rally.
Underscoring just how much investors fear for their financial safety, the World Gold Council (WCG) recently reported that European purchase of bullion bars and coins rose 15%. This reveals investors' demand for gold for capital preservation in light of the European debt and banking crises. The WGC emphasized that Russia will continue to be a driving force in the gold market. It is now the fourth largest consumer of gold jewelry and has the world's eighth largest gold reserves. There are enough economic crises out there on the horizon to keep gold buoyant for some time to come.
Looking beyond 2012, gold will have the additional support of increasing financial market volatility in the 2013-2014 period. During this time the 60-year cycle will be in its final descent before bottoming in late 2014. This cycle will be responsible for all kinds of deflationary pressures throughout the global economy, and this should benefit gold. Keep in mind that gold benefits from both ends of the 60-year economic super cycle, namely runaway inflation and runaway deflation. Accordingly, gold should prove to be the ultimate financial safe haven in the coming two years.
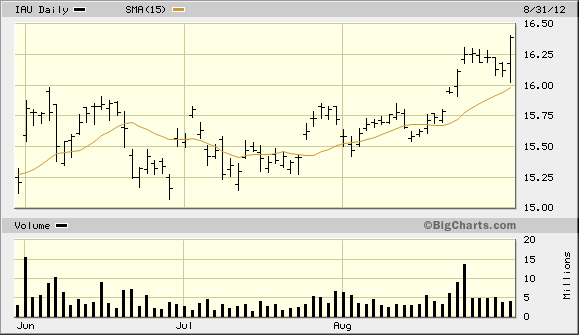
Turning our attention to the short-term technical outlook for gold, the iShares Gold Trust ETF (IAU), my favorite gold proxy, confirmed an immediate-term breakout per the rules of the 15-day moving average trading method in late July. Since then IAU has rallied 4 percent, which is the minimum expectation of what the trading discipline tells us.
Historically, buy signals generated by the 15-day moving average (unless there is a bear market underway) result in a minimum advance of 4 percent, with a maximum average gain of 8-10 percent before the first correction begins. Under optimal conditions, we would expect the gold ETF to gain an additional 4-6 percent before commencing its next correction phase.
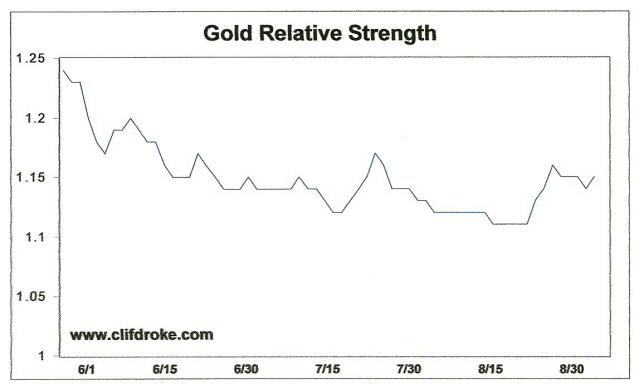
“Optimal conditions” is the operative term here. Every rose has its thorns, and so does every bull market. The proverbial thorn in gold’s side right now is a lack of corresponding relative strength. Although gold’s price has risen impressively, the gold relative strength indicator has so far failed to confirm the higher high in the gold price. The following graph illustrates this problem:
Unless there is a rapid increase in gold’s relative strength in the next few days, the lagging nature of this indicator suggests that gold will remain vulnerable to a correction before achieving its full upside potential based on the historical pattern. This is strictly a short-term consideration, however, as the fundamentals for the longer-term bull market in gold are still firmly intact.
- English (UK)
- English (India)
- English (Canada)
- English (Australia)
- English (South Africa)
- English (Philippines)
- English (Nigeria)
- Deutsch
- Español (España)
- Español (México)
- Français
- Italiano
- Nederlands
- Português (Portugal)
- Polski
- Português (Brasil)
- Русский
- Türkçe
- العربية
- Ελληνικά
- Svenska
- Suomi
- עברית
- 日本語
- 한국어
- 简体中文
- 繁體中文
- Bahasa Indonesia
- Bahasa Melayu
- ไทย
- Tiếng Việt
- हिंदी
Why Gold Doesn’t Need The Fed
Published 09/02/2012, 06:01 AM
Updated 07/09/2023, 06:31 AM
Why Gold Doesn’t Need The Fed
3rd party Ad. Not an offer or recommendation by Investing.com. See disclosure here or
remove ads
.
Latest comments
gold vil go till 32600 for sure... it can go down frm der...
soros and paulson bought gold under 1,600 with preemptive speculation of QE3 in september and now need to unload and book 100 profit from late to the party:)
beware of gold speculators . they just need someone who buy there position and they want to exit from it .so my opinion don't buy gold until Jan 2014 and my price target for Gold is $ 1320 per ounce and silver near $20 . just away from the bullish bets in bullion
Install Our App
Risk Disclosure: Trading in financial instruments and/or cryptocurrencies involves high risks including the risk of losing some, or all, of your investment amount, and may not be suitable for all investors. Prices of cryptocurrencies are extremely volatile and may be affected by external factors such as financial, regulatory or political events. Trading on margin increases the financial risks.
Before deciding to trade in financial instrument or cryptocurrencies you should be fully informed of the risks and costs associated with trading the financial markets, carefully consider your investment objectives, level of experience, and risk appetite, and seek professional advice where needed.
Fusion Media would like to remind you that the data contained in this website is not necessarily real-time nor accurate. The data and prices on the website are not necessarily provided by any market or exchange, but may be provided by market makers, and so prices may not be accurate and may differ from the actual price at any given market, meaning prices are indicative and not appropriate for trading purposes. Fusion Media and any provider of the data contained in this website will not accept liability for any loss or damage as a result of your trading, or your reliance on the information contained within this website.
It is prohibited to use, store, reproduce, display, modify, transmit or distribute the data contained in this website without the explicit prior written permission of Fusion Media and/or the data provider. All intellectual property rights are reserved by the providers and/or the exchange providing the data contained in this website.
Fusion Media may be compensated by the advertisers that appear on the website, based on your interaction with the advertisements or advertisers.
© 2007-2024 - Fusion Media Limited. All Rights Reserved.
