
After S&P’s recent upgrade to its outlook on Delta Airlines (DAL), I can't help but wonder how they do their analysis. My take on Delta shows that the company’s financial position is getting worse not better.
The difference in my analysis is generally derived from the data I get from footnotes. When I read DAL’s latest 10-K report, I find that the growth of the company’s off-balance-sheet liabilities is larger than the reduction in the company’s on-balance-sheet debt.
Most of the off-balance-sheet liabilities are related to employee benefits (pensions and postretirement plans), which have a senior claim to the company’s cash flows over any debt. Accordingly, I do not understand how S&P would say the outlook for Delta’s debt ratings is getting better when senior claims are as high as they are.
The Details
At the end of 2011, my analysis shows DAL’s pensions and postretirement plans were under-funded by $14.1 billion (per page 76 of the company’s 2011 10-K) and DAL had $8.2 billion in off-balance sheet debt from operating leases. That's a total of $22.3 billion in off-balance-sheet liabilities, a $2.7 billion (14%) increase over the total in 2010. Figure 1 below plots the increase in off-balance-sheet liabilities since DAL emerged from bankruptcy.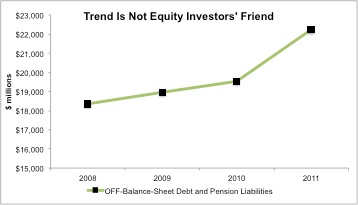
Delta’s underfunded pension and postretirement liabilities grew from $11.4 billion in 2010 to $14.1 billion in 2011. Its off-balance sheet debt grew as well, though only by $69 million to $8.2 billion. Together, underfunded pension and postretirement liabilities -- plus off-balance sheet debt -- grew by $2.7 billion, which is significantly greater than the $1.5 billion decrease in its on-balance-sheet debt in 2011.
Figure 2 compares the trend in DAL’s off-balance-sheet liabilities to its on-balance-sheet debt. It highlights how the off-balance-sheet liabilities are growing faster than the reduction in the on-balance-sheet debt.
To get a proper sense of the company’s financial position, one must assess both the on- and off-balance-sheet liabilities.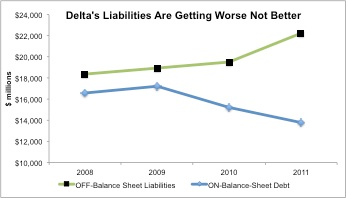
Given the growth and trend in DAL’s off-balance sheet liabilities, I would not be comfortable as a debt or equity investor in the company.
As detailed in last weekend’s Barron’s and in “Bail Out Of Delta”, the company’s accounting practices allow it to report lower-than-normal expenses related to its pensions. As a result, I suggest investors look below the surface of DAL’s reported earnings.
Long Time Coming
Even if one takes DAL’s first quarter 2012 earnings at face value and trust that the company’s cash flow from operations is about $950 million, it would take about 38 quarters of equal or better performance for DAL to pay down the $36 billion in total debt and underfunded pension liabilities currently on its books. Cash flow net of capex in the first quarter was about $600 million, which would have to be maintained for 60 quarters (15 years) to pay down the $36 billion in total debt and underfunded pension liabilities.
True, the U.S. economy and stock markets enjoyed a better-then-expected first quarter in 2012. I wonder how many investors are willing to bet that we will enjoy 38 to 60 more like it…consecutively. The recent announcement that Delta plans to cut capacity on its trans-Atlantic routes by 5% does not exactly inspire expectations for profit growth. Nor do recent economic reports on jobs. Few would argue that Europe will be anything but a formidable head wind.
For those that say all this information is already baked into the stock price, I suggest you look again. According to my discounted cash-flow model, to justify the stock valuation at $12/share, the company has to grow its after-tax cash flow (NOPAT) by 15% compounded annually for nine years. If I lower the implied growth rate to 10%, the current valuation implies 10% growth in NOPAT compounded annually for 23 years. I underscore that those are the expectations baked into the current stock price. For investors to believe DAL deserves a higher valuation/stock price, they must believe that the company’s future profit growth will be even greater than that baked into today's stock price.
I would say the odds are low that DAL can meet current expectations and that odds are rather high the company’s future profits will be much lower that what the market expects. I suggest investors take heed now before the stock falls further.
I also recommend investors avoid the ETFs and mutual funds that allocate the most to DAL.
DAL Mutual Funds To Avoid:
- CGM Trust: CGM Focus Fund (CGMFX) – Dangerous Rating
- Professionally Managed Portfolios: Hodges Pure Contrarian Fund (HDPCX) – Dangerous Rating
- Natixis Funds Trust I: CGM Advisor Targeted Equity Fund (NEBGX) – Dangerous Rating
- John Hancock Funds III: Leveraged Companies Fund (JVCBX) – Very Dangerous Rating
- Fidelity Select Portfolios: Transportation Portfolio (FSAIX) – Dangerous Rating
- SPDR S&P Transportation ETF (XTN) – Dangerous Rating
- PowerShares XTF: Dynamic Market Portfolio (PWC) – Neutral Rating
- PowerShares Dynamic Industrials (PRN) – Neutral Rating
- iShares Dow Jones Transportation Average Index Fund (IYT) – Neutral Rating
- First Trust Industrials/Producer Durables AlphaDEX Fund (FXR) – Neutral Rating