According to Knoema.com, there are a limited number of countries worldwide with a real GDP growth of more than 6%. Those countries are mostly very small, so we selected the three largest countries with a real GDP growth of more than 6%, and analyzed their stock market index.
We concluded that stock market in India has the most attractive setup. So India should be very high on your watchlist in 2016. The final trigger to enter a position will be an Emerging Markets Index breakout combined with emerging market currency strength. Most likely, that will take place once commodities will stop their sell off.
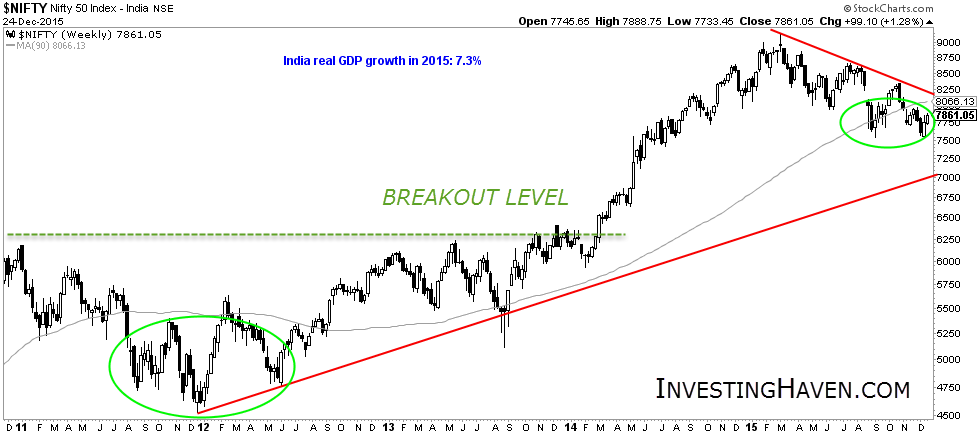
India has a real GDP growth of 7.3%. Its stock market broke out at 6250 points, early 2014. As seen on the first chart, the stock index is creating a triangle. Moreover, the stock index broke below the important 90 week moving average (WMA). The apex of the triangle will be slightly below the 90 WMA, which really is not a coincidence.
Watch the 90 WMA and the triangle formation in 2016, for any clues of a new direction (bullish or bearish).

Note on the above chart that the Indian stock market was trading below its important 90 WMA for a year, but it confirmed its uptrend with a higher below below that 90 WMA, and a successful test at a certain point. That type of pattern is very likely to repeat in 2016.
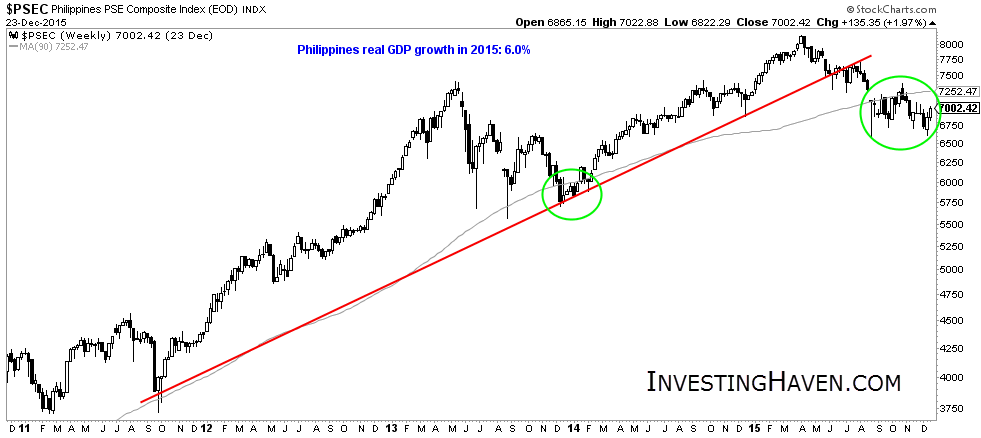
The Philippines have a 6.0 real GDP growth. The stock market index over there broke below a long term uptrend during the spring of this year, and confirmed the breakdown in the summer. Since then, it is trading right below its 90 WMA. This pattern does not look very constructive, although a recovery is certainly in the cards as the index is trading right below the 90 WMA. All in all, we are not as excited for the Philippines as we are on India.

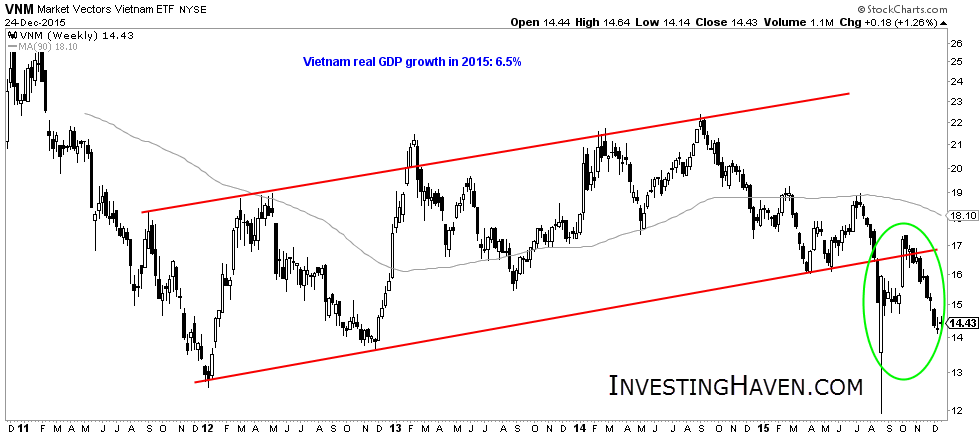
The third emerging market in our shortlist is Vietnam (N:VNM). It has a real GDP growth of 6.5%. Its stock market, however, does not look attractive. It is way below its 90 WMA, and broke down this summer from a 3-year trend channel. We do not trust this.

CONCLUSION:
India has a great combination of a strong economic growth and a very attractive stock market chart pattern. We would like to see the support line hold, and a consolidation around the 90 WMA. If you would consider any emerging market in 2016, it should be India, without any doubt!
