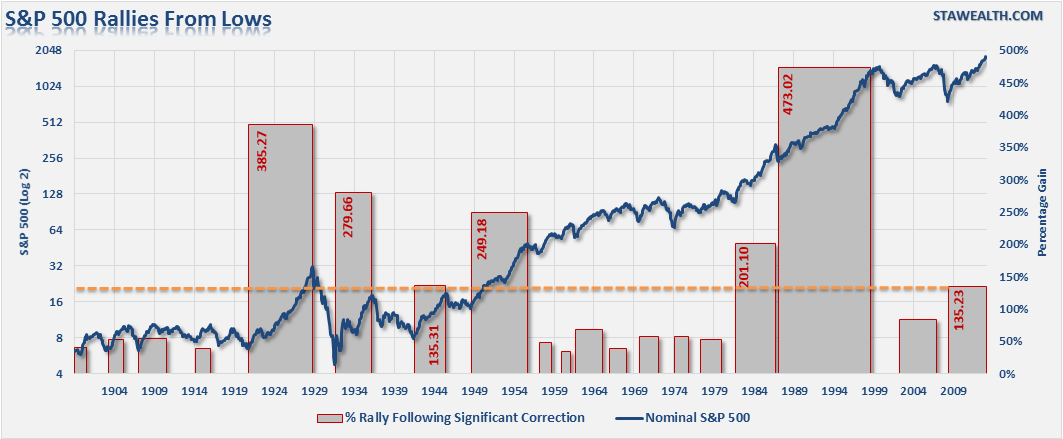
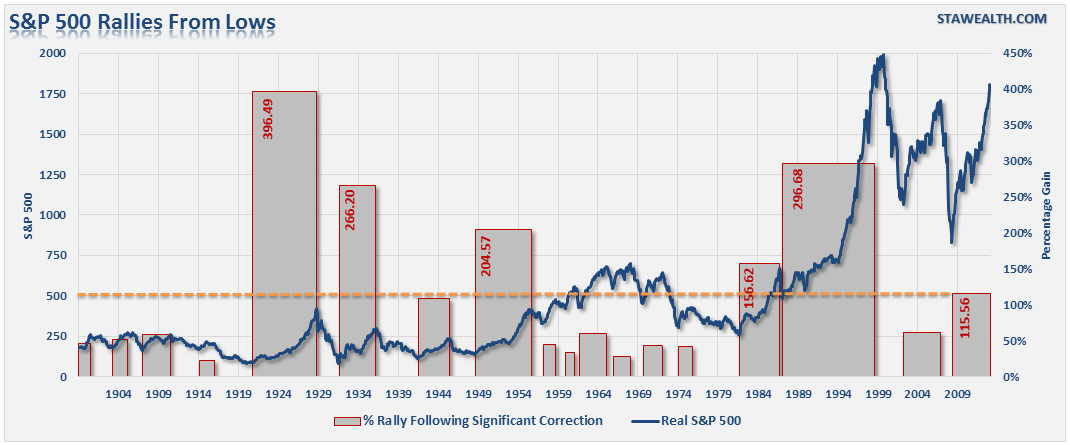
Today's chart of the day is a simple analysis using Prof. Robert Shillers stock market data to look at where the current stock market rally exists in relation to previous market rallies following either cyclical or secular bear market corrections. I have analyzed the data using both nominal and real (inflation adjusted) prices.
If we look at nominal market prices going back to 1900, we find that the current rally of 135.23% (as of January 27th close) ranks as the 7th longest rally in history. As shown in the chart below the current rally ranks behind the 1920-29 market bubble, the post-WWII bull market and the "tech boom" of the 90's.
However, when looking at inflation adjusted data the picture changes slightly.
The current rally of 115.56% is the 6th longest in history with the market still below its 2000 peak.
This data alone really doesn't mean much in isolation. It would be relatively easy to argue, according to the charts above, that the markets could go significantly higher from current levels. However, price data must be aligned to valuations and as I stated in "Market Bulls Should Consider These Charts:"
"While the promise of a continued bull market is very enticing it is important to remember, as investors, that we have only one job: "Buy Low/Sell High." It is a simple rule that is more often than not forgotten as "greed" replaces "logic." However, it is also that simple emotion of greed that tends to lead to devastating losses.
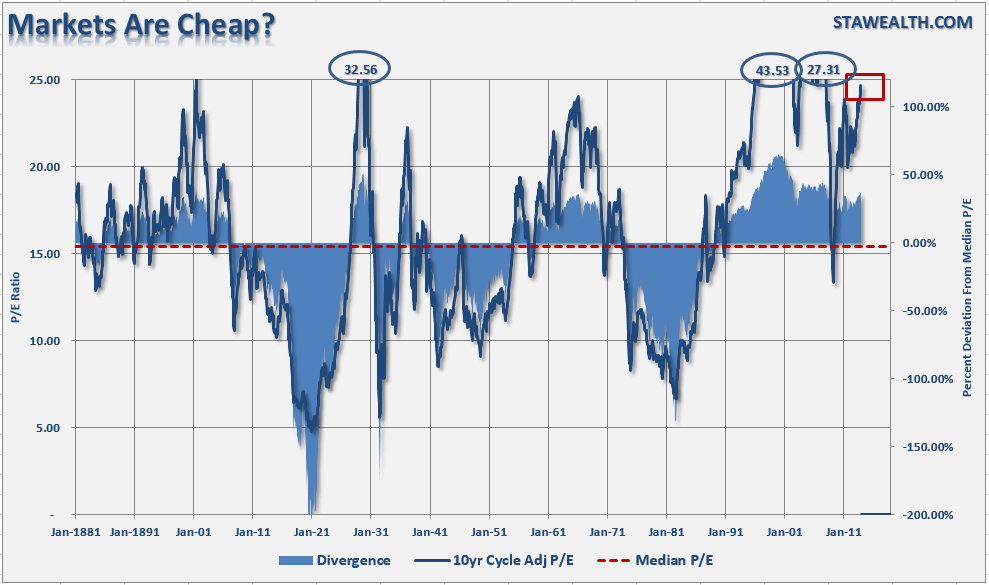
The chart below shows Dr. Robert Shiller's cyclically adjusted P/E ratio. The problem is that current valuations only appear cheap when compared to the peak in 2000. In order to put valuations into perspective, I have capped P/E's at 25x trailing earnings as this has been the level where secular bull markets have previously ended. I have noted the peak valuations in periods that have exceeded that level."
As you will notice, we are currently at valuation levels where previous bull markets have ended rather than continued. I recently suggested that we are most likely repeating the secular bear market of the 70's :
"Despite much hope that the current breakout of the markets is the beginning of a new secular "bull" market - the economic and fundamental variables suggest otherwise. Valuations and sentiment are at very elevated levels which is the opposite of what has been seen previously. Interest rates, inflation, wages and savings rates are all at historically low levels which are normally seen at the end of secular bull market periods.
Lastly, the consumer, the main driver of the economy, will not be able to become a significantly larger chunk of the economy than they are today as the fundamental capacity to releverage to similar extremes is no longer available."
While stock prices can certainly be driven much higher through the Federal Reserve's ongoing interventions, the inability for the economic variables to "replay the tape" of the 80's and 90's increases the potential of a rather nasty mean reversion at some point in the future. It is precisely that reversion that will likely create the "set up" necessary to start the next great secular bull market.
As I have discussed many times in the past, as a money manager, I am currently very cautiously invested in the stock market. I must be, or I potentially suffer career risk. However, my job as an advisor is not only to make money for my clients, but also to preserve their gains, and investment capital, as much as possible. Understanding the bullish arguments that support markets rise is important, however, the real risk to investors is the eventual and inevitable "reversion to the mean". In other words, what comprises that "light at the end of the tunnel" is critically important to the future of your investment success.


